Facebook Twitter Instagram YouTube

Written on: March 22nd, 2021 in Living Shorelines
By Kenny Smith, DNREC’s Wetland Monitoring and Assessment Program
When discussing living shorelines, you might not think the hardest and most unclear part would be getting your permits to accomplish this work. The permit process is sometimes difficult to navigate and can be confusing to someone not immersed in the environmental field. We decided to reach out to DNREC’s Wetlands and Subaqueous Land Section (WSLS) to answer some questions to clear up the confusion and better understand the process.
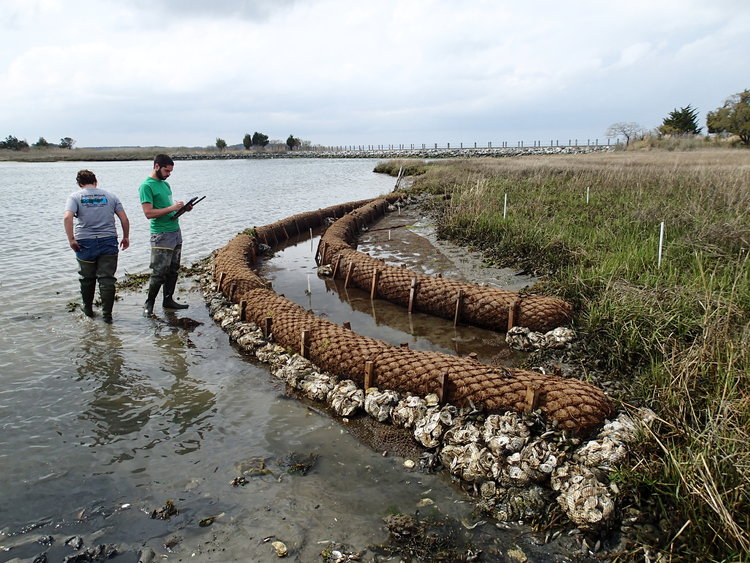
With these questions and answers I hope we have helped ease the confusion and provided some insight into the common questions relating to permits of living shorelines. This will not answer all of your questions, but DNREC is here – always reach out to the resources to get any clarification.

Written on: March 22nd, 2021 in Wetland Assessments
By Alison Rogerson, DNREC’s Wetland Monitoring and Assessment Program
What is a state wetland program plan?
Delaware creates five-year wetland program plans to serve as a guide that identifies and prioritizes areas where information or action is needed to advance wetland management statewide. It is created using the goals of many different wetland players across the state.
We use action plans, strategies, and communications with many conservation partners to drive the action items in each five-year plan. The 2021 plan follows similar versions from 2010 to 2016.
What kind of wetland work does the plan include?
We have seen seven focused goals in each wetland program plan; mapping, monitoring, climate change, restoration, collaboration, education, and regulation. These goals line up nicely with wetland priorities listed by the Environmental Protection Agency (EPA). This alignment makes it easier for an organization or agency proposing projects or applying for funding assistance to receive support.
How do we measure past success?
The 2016-2020 Wetland Program Plan included 45 action items (under the same seven goals) and were derived from state needs in 2015. By the close of 2020, 30 of those actions items were either complete or in progress. Some action items are finite and can be checked off. Others are constantly evolving and will never really be “done” but we continue to make progress.
Looking back at the strengths and weaknesses of the Delaware wetland program between 2016 and 2020, we made strong advancements in mapping, monitoring, climate change, and education but left “points on the table” when it came to restoration and regulations. Delaware still lacks a freshwater wetland conservation program and there are opportunities to protect Delaware’s rarest and unique wetlands on a state and county level.
What’s new in the 2021 Program Plan?
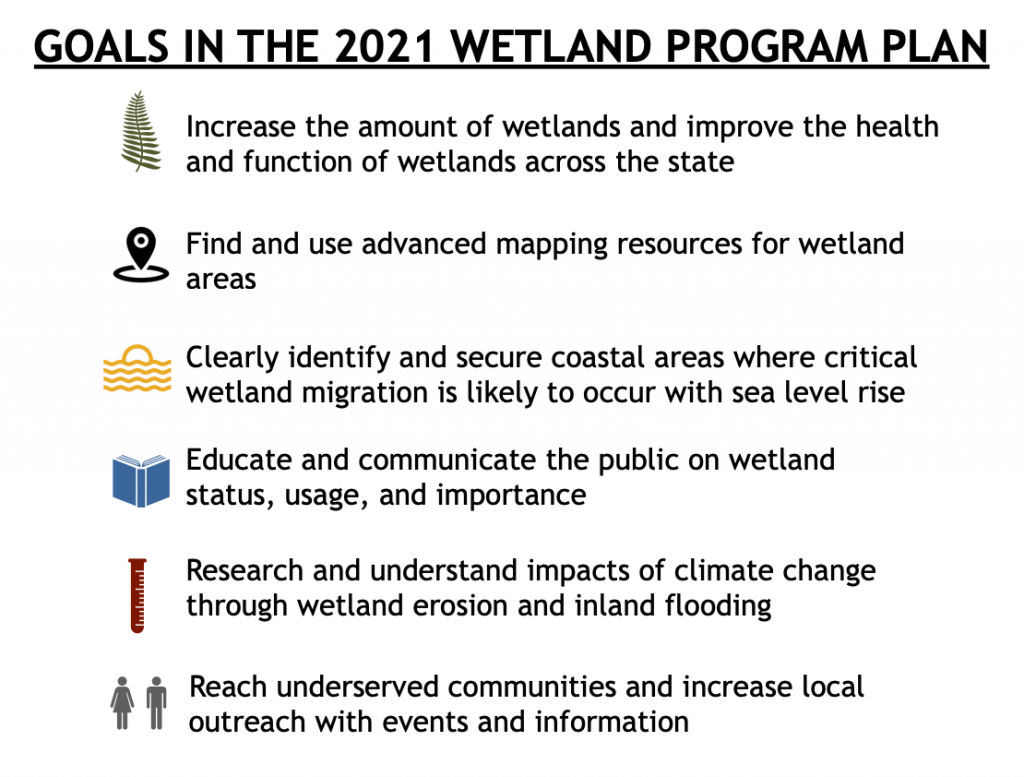
Our main goal to increase the amount of wetlands we have and improve the health and function of wetlands across the state has not changed. We are always looking to find the best mapping resources available, use the best science to rate our wetland function, and push ourselves to educate and communicate better. Climate change continues to be a priority as we witness coastal wetland erosion and inland flooding.
New in this version is the need to clearly identify and secure coastal areas where critical wetland migration is likely to occur with sea level rise. Also, establishing a program that encourages wetland mitigation through a banking system that saves up to pay for large restoration projects. Lastly, making sure that we are reaching underserved communities with events and information.
The updated Delaware Wetland Program Plan will hopefully serve us for the next five years as we continue to improve and strengthen Delaware’s wetland conservation and management programs.

Written on: March 22nd, 2021 in Wetland Restoration
By Ezra Kottler, The George Washington University
All over the world, sea-level rise is driving changes in natural habitats. Greenhouse gas emissions have brought about the warming of oceans and melting of glaciers such that global mean sea level is increasing over time and the rate at which it increases is getting steeper and steeper 1. The Mid-Atlantic region is a particular “hot spot” for sea-level rise because of additional local conditions that include:
Due to the fact that the coastal Mid-Atlantic is flat and close to sea-level, a few inches of increased water can significantly increase the frequency of flooding from hurricanes and tropical storms. Not to be forgotten, another major outcome of sea-level rise is large scale habitat changes through marsh migration.
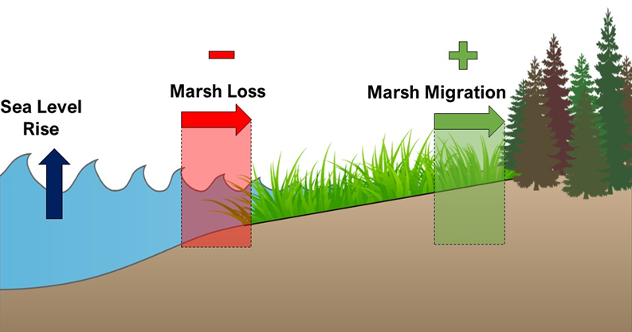
How can habitat migrate?
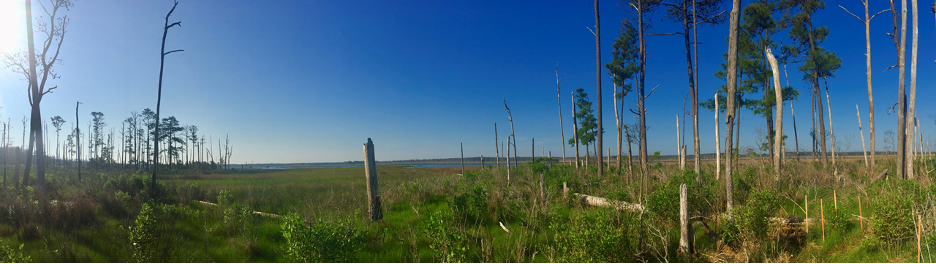
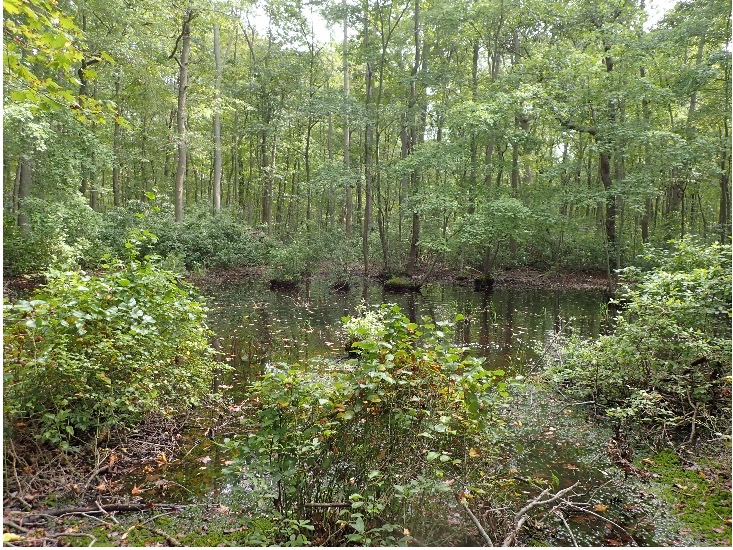
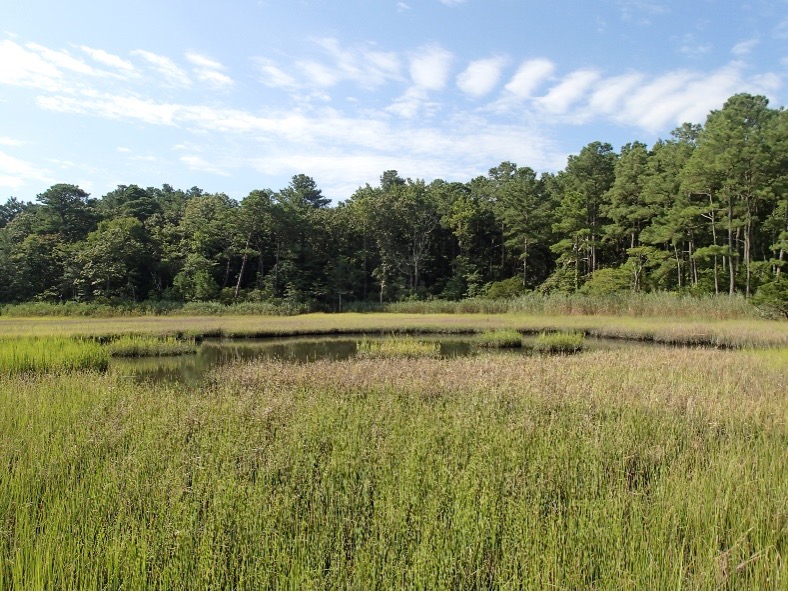
When we say marsh migration, it means something a bit different than animal migrations like monarch butterflies or blue whales. Marsh migration is a process of non-wetland coastal plants, like pine trees, dying due to storms and saline soils at the marsh boarder, then marsh plants growing in their place. This is a natural process that has always taken place a bit at a time, but in recent decades it has begun to speed up with sea-level rise. The ghost forests of dead pine trunks show the impacts of climate change here and now in our region 3, but marsh migration also provides hope. Marsh migration can actually help counteract the loss of marsh habitat that is drowning with higher sea levels, thus preserving important ecosystem services.
Our lab is studying what changes are happening at the moving border between marsh and the pine forest habitat. A major part of my graduate study research is looking for changes to the growth and success of salt marsh hay (Spartina patens), a native marsh grass, as it migrates into coastal forests. Salt marsh hay is a foundation species, meaning it creates physical conditions that allow other organisms to survive under the harsh conditions, like hot and humid salt marshes. Its presence on the landscape reduces water loss under the hot summer sun, provides food and hunting grounds for a diversity of animals, and critically, serves as the only suitable nesting habitat for many native and endangered shorebirds 4. But as salt marsh hay starts growing in the forest understory, and is released from the stress of sun and salt, the species faces a new challenge. With little to no light at times during the seasons in the forest understory, salt marsh hay has difficulty getting enough light to do the photosynthesis needed to keep food (in this case glucose) on the table.
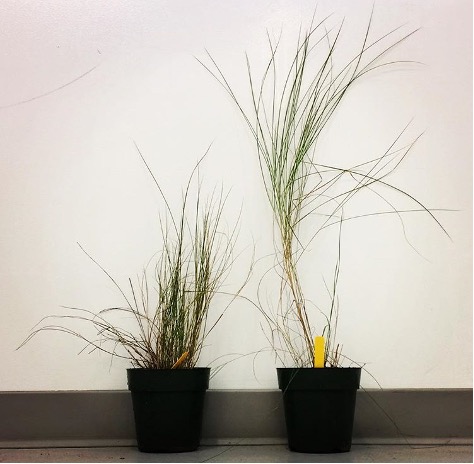
For the past few years I have carried out a series of experiments growing salt marsh hay in different environmental conditions. When grown under the limited light conditions of canopy, salt marsh hay grows longer stems and wider leaves to maximize how much surface area it can use for photosynthesis. This is similar to what happens to lettuce and other garden greens when you grow them under a shade cloth. At the same time, salt marsh hay makes fewer roots and stems, and is unable to flower when shaded by the pine tree canopy. This might be a problem for shaded salt marsh hay populations, as they must rely on growing new stems to expand their distribution, and cannot produce seeds.
But there is also reason for hope: salt marsh hay seems to be very flexible in its responses to the environment. When individuals from the forest were grown in the marsh, they rapidly grew more stems and roots, growing more robust. Our management decisions in these transitional coastal areas can help facilitate the migration of native marsh species over invasive species. By making the best management practices for our ecosystems, we can enjoy the beauty and benefits of marshes for generations to come.
References
1 Nicholls, R.J., Cazenave, A., 2010. Sea-Level Rise and Its Impact on Coastal Zonea. Science 318, 1517-1520. https://doi.org/10.1126/science,1185782
2 Piecuch, C.G., Huybers, P., Hay, C.C., Kemp, A.C., Little, C.M., Mitrovica, J.X., Ponter, R.M., Tingley, M.P., 2018. Origin of spatial variation in US East Coast sea-level trends during 1900-2017. Nature 564, 400-404. https://doi.org/10.1038/s41586-018-0787-6
3 Gedan, K. (2021, March 16). Ghosts of the Coast. Retrieved from https://storymaps.arcgis.com/stories/12863715c76a40d8928e467845801b03
4 Wilson, M.D., Watts, B.D., Brinker, D.F., 2007. Status Review of Chesapeake Bay Marsh Lands and Breeding Marsh Birds. Waterbirds 30, 122-137. https://doi.org/10.1675/1542-4695(2007)030[0122:SROCBM]2.0CO;2
Written on: March 22nd, 2021 in Wetland Assessments
By Erin Dorset, DNREC’s Wetland Monitoring and Assessment Program
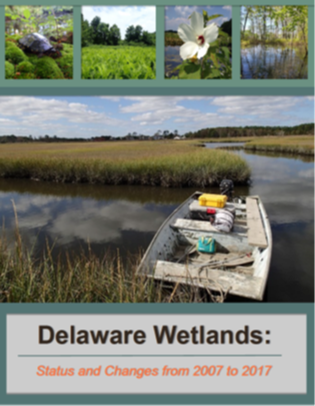
Back in December, WMAP introduced you to DNREC’s new 2017 wetlands maps. Since then, WMAP has been hard at work finalizing a report detailing the status and trends of wetlands throughout the State of Delaware. Soon, the entire report will be available, but in the meantime, here is a sneak preview!
Tracking Acreage to Shape Wetland Management
In recent years, significant wetland losses have been documented in Delaware, as have been shown in wetland status and trends reports from 1981-1992 and 1992-2007. It is vitally important to track wetland acreage over time to see where in Delaware these losses are occurring and why they have been happening. This way management recommendations can be targeted to specific areas, wetland types, and issues to be most effective. Right now, WMAP is using DNREC’s brand new state wetland maps that are based on 2017 aerial imagery to analyze current wetland acreage status and trends since the last mapping effort in 2007.
Wetland Acreage Status: 2017
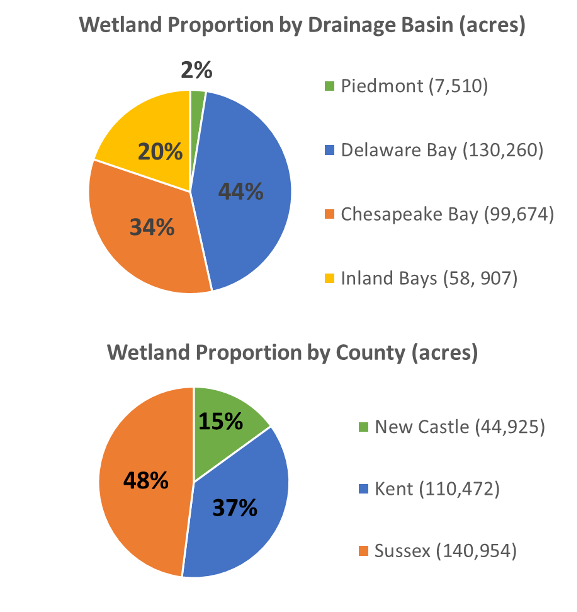
According to DNREC’s new 2017 wetland maps, there are 296,351 acres of wetlands in Delaware. Most wetlands (44%) are part of the Delaware Bay drainage basin, meaning that water that is flowing through those wetlands eventually ends up draining east to Delaware Bay. There are also many wetlands in the Chesapeake Bay basin in western Delaware (34%) and the Inland Bays basin in southern Delaware (20%). Far fewer wetlands exist in the Piedmont drainage basin in northern Delaware (2%). Almost half of all wetlands (48%) in Delaware are in Sussex County, followed by Kent County (37%), and New Castle County (15%).
Wetland Types
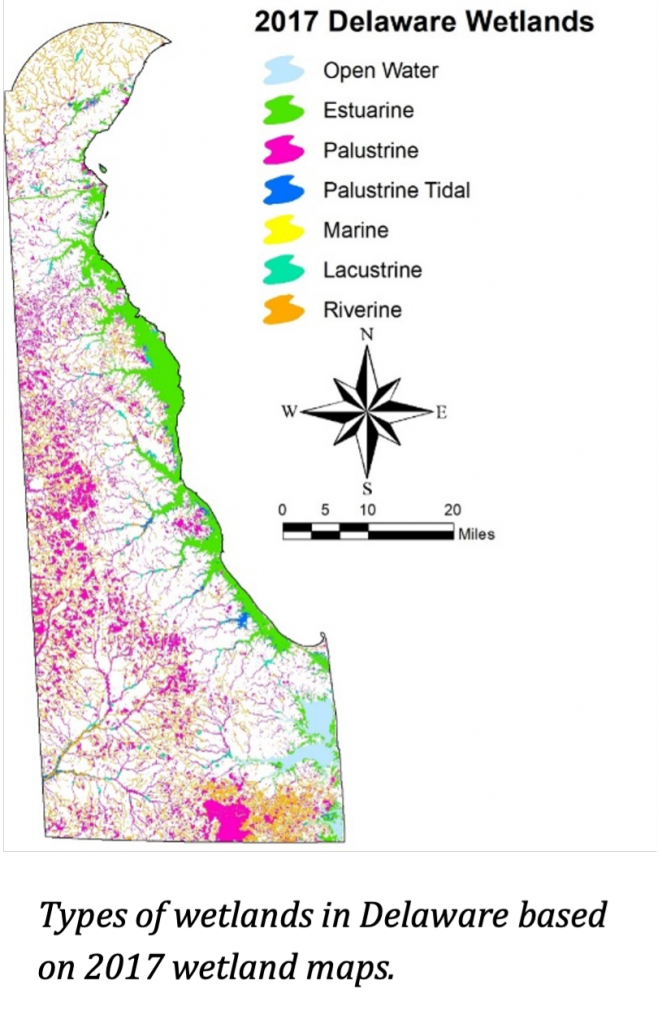
Nearly a quarter of Delaware is made up of wetlands. The map on the right showcases how the locations of these areas are spread vastly across the state. With a variety of different types of wetlands Delaware has, some types are concentrated in certain areas over others.
Non-tidal wetlands
Over half of all wetlands (52%) in Delaware are non-tidal freshwater wetlands, also known as non-tidal palustrine wetlands (pink on the map), amounting to 152,012 acres. Most of those non-tidal areas are forested and occur throughout the state, though they are most concentrated in the central and western parts of the state. Aside from forested wetlands, some non-tidal wetlands are dominated by shrubs or non-woody plants such as grasses or rushes. Some, though fewer, non-tidal wetlands lack plants.
Tidal Wetlands
Tidal wetlands, including tidal saltwater (estuarine; green on map) and tidal freshwater wetlands (palustrine tidal; dark blue on map), make up 126,260 acres throughout the state, or 43% of the statewide acreage total. Most of those are saltwater wetlands – also known as estuarine – which occur along the Delaware Bay and Inland Bays and make up 90% of tidal wetlands. Many of those estuarine wetlands represent a habitat type known as low marsh, which is typically flooded at every high tide and dominated by the plant saltmarsh cordgrass (Spartina alterniflora). Fewer estuarine wetlands represent high marsh habitat, which is at a slightly higher elevation than low marsh and is therefore flooded less frequently. Unfortunately. the invasive European reed (Phragmites australis), which can be detected in aerial imagery, is present in over half of the mapped high marsh habitats.
Tidal freshwater wetlands only make up 10% of tidal wetlands statewide and occur along waterways slightly more inland than estuarine wetlands. Those areas still experience tides but are far enough away from the bay or ocean that they have fresh water instead of salt water.
Others
Riverine, lacustrine, and marine were the other categories that were mapped in the 2017 project. Each of these categories only make up very small proportions of total statewide acreage. Riverine wetlands (orange on map) make up just 3% of the statewide total and represent streams or rivers all over the state. Marine wetlands (yellow on the map) only make up less than 1% of statewide total. These are rocky or sandy shorelines right along the Atlantic Ocean in southern Delaware. Lacustrine wetlands (aqua on map) represent 2% of statewide total. Those wetlands are ponds or pond edges, and are scattered all over Delaware. Open water, including large waterbodies of the Inland Bays, was not included as a part of the 2017 wetland mapping effort, though it is illustrated on the map in light blue.
Are we gaining or losing wetlands in Delaware?
In addition to looking at current wetland acreage status in Delaware, WMAP also examined wetland losses, gains, and wetland type changes that occurred between 2007 (the year the last mapping effort occurred) and 2017. Stay tuned for another blog post coming soon that will cover these topics!
Note that the mapping layers discussed here represent biological wetlands and do not serve as regulatory or jurisdictional boundaries. Contact DNREC’s Watershed Assessment Section with questions or issues accessing or using these data at (302)-739-9939.
Delaware's Governor
State Agencies
Elected Officials
General Assembly
Delaware Courts
State Employees
Cities & Towns
Delaware State Code
State Regulations
Business First Steps
Phone Directory
Locations Directory
Public Meetings
Voting & Elections
Transparency
Delaware Marketplace
Tax Center
Personal Income Tax
Privacy Policy
Weather & Travel
Contact Us
Corporations
Franchise Tax
Gross Receipts Tax
Withholding Tax
Delaware Topics
Help Center
Mobile Apps
E-mail / Text Alerts
Social Media

Built by the Government Information Center
©MMXVIII Delaware.gov

