Facebook Twitter Instagram YouTube

Written on: September 24th, 2020 in Wetland Assessments
By Alison Rogerson, DNREC’s Wetland Monitoring and Assessment Program
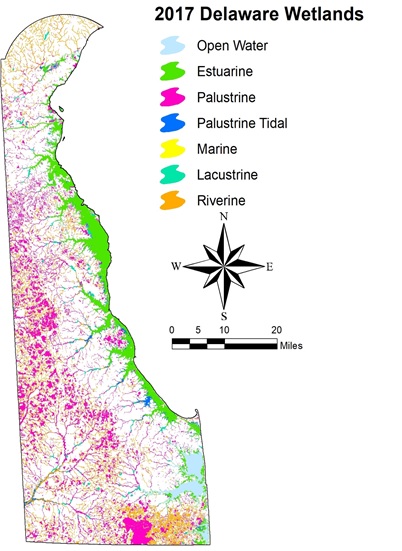
Map of Delaware’s wetlands based on 2017 imagery.
Measuring wetland health and function is a primary task for DNREC’s Wetland Monitoring and Assessment. We work on this every year, one watershed at a time. Tracking wetland acreage across the state is also vitally important to managing Delaware’s wetland. Updating statewide wetland maps is a lot of work and costly and is done every 10-15 years.
In 2017, DNREC embarked on a 10-year update of Delaware’s statewide wetland maps. These maps use a computer analysis and the best technology available to draw wetlands of all types into a GIS layer and create a census of biological wetlands. These maps are hugely important for understanding what kind of wetlands Delaware has and how they are changing over time.
After much processing and quality checks we are excited to present several new wetland layers available to the public for access. Those readers familiar with the U.S. Fish and Wildlife Service NWI Wetland Mapper should note that Delaware has been updated with the 2017 data.
Another host for accessing and downloading new wetland maps is FirstMap under Hydrology as Delaware Wetlands where there are multiple layers available:
1. 2017 Wetlands- maps all types of wetlands by two classification schemes (NWI and LLWW). This layer now also includes surface water features from the NHD layer, so streams and ditches and rivers are mapped alongside wetlands in one place.
2. Wetland Trends- this layer was created by laying the 2017 wetland map over the 2007 wetland map and noting any differences (gains, losses or changes in wetland type). Some of the losses may have been permitted or naturally occurring. Some of the changes or shifts in wetland types were caused by natural processes such as sea level rise or succession.
3. High Marsh/Low Marsh – this is a brand new layer that serves as a baseline assessment of these habitat types to help track future response to climate change and sea level rise. Low marsh habitat would typically be dominated by Spartina alterniflora. High marsh habitat is likely to be Spartina patens, Iva frutescens, or Distichlis spicata.
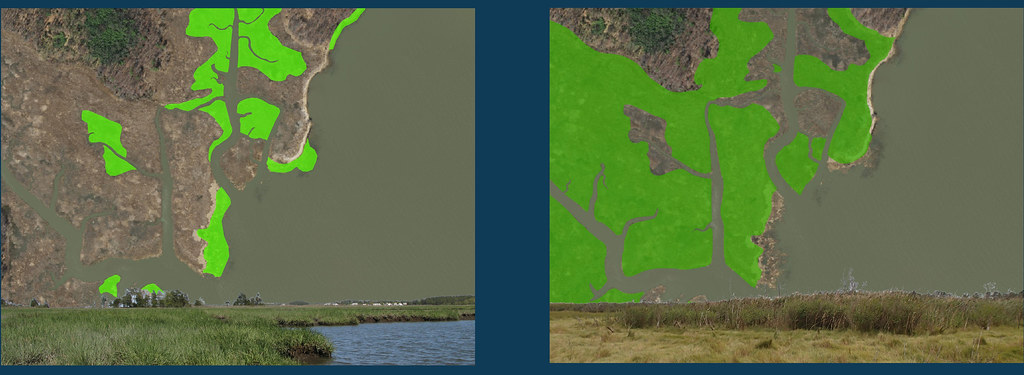
Example of low marsh (left) and high marsh (right) data sets.
4. Ordinary High Water Line – depicts high water line along the coast, generally following the high marsh upper boundary, and can be useful for landuse planning to estimate the upper extent of tidal influence.

Example of high water line layer along coast.
5. As a historic reference the 1992 Wetlands and 2007 Wetlands layers are still available online.
These mapping layers represent biological wetlands and do not serve as regulatory or jurisdictional boundaries. Contact Watershed Assessment Section with questions or issues accessing or using these data at (302) 739-9939.
Stay tuned for a story map that summarizes results from the new data and highlights the updated layers offered to the public.
Delaware's Governor
State Agencies
Elected Officials
General Assembly
Delaware Courts
State Employees
Cities & Towns
Delaware State Code
State Regulations
Business First Steps
Phone Directory
Locations Directory
Public Meetings
Voting & Elections
Transparency
Delaware Marketplace
Tax Center
Personal Income Tax
Privacy Policy
Weather & Travel
Contact Us
Corporations
Franchise Tax
Gross Receipts Tax
Withholding Tax
Delaware Topics
Help Center
Mobile Apps
E-mail / Text Alerts
Social Media

Built by the Government Information Center
©MMXVIII Delaware.gov

