Facebook Twitter Instagram YouTube

Written on: March 22nd, 2021 in Wetland Assessments
By Erin Dorset, DNREC’s Wetland Monitoring and Assessment Program
Back in December, WMAP introduced you to DNREC’s new 2017 wetlands maps. Since then, WMAP has been hard at work finalizing a report detailing the status and trends of wetlands throughout the State of Delaware. Soon, the entire report will be available, but in the meantime, here is a sneak preview!
Tracking Acreage to Shape Wetland Management
In recent years, significant wetland losses have been documented in Delaware, as have been shown in wetland status and trends reports from 1981-1992 and 1992-2007. It is vitally important to track wetland acreage over time to see where in Delaware these losses are occurring and why they have been happening. This way management recommendations can be targeted to specific areas, wetland types, and issues to be most effective. Right now, WMAP is using DNREC’s brand new state wetland maps that are based on 2017 aerial imagery to analyze current wetland acreage status and trends since the last mapping effort in 2007.
Wetland Acreage Status: 2017
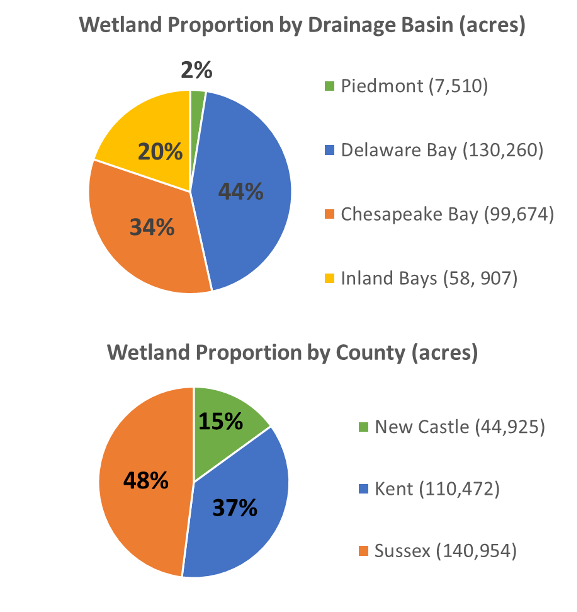
According to DNREC’s new 2017 wetland maps, there are 296,351 acres of wetlands in Delaware. Most wetlands (44%) are part of the Delaware Bay drainage basin, meaning that water that is flowing through those wetlands eventually ends up draining east to Delaware Bay. There are also many wetlands in the Chesapeake Bay basin in western Delaware (34%) and the Inland Bays basin in southern Delaware (20%). Far fewer wetlands exist in the Piedmont drainage basin in northern Delaware (2%). Almost half of all wetlands (48%) in Delaware are in Sussex County, followed by Kent County (37%), and New Castle County (15%).
Wetland Types
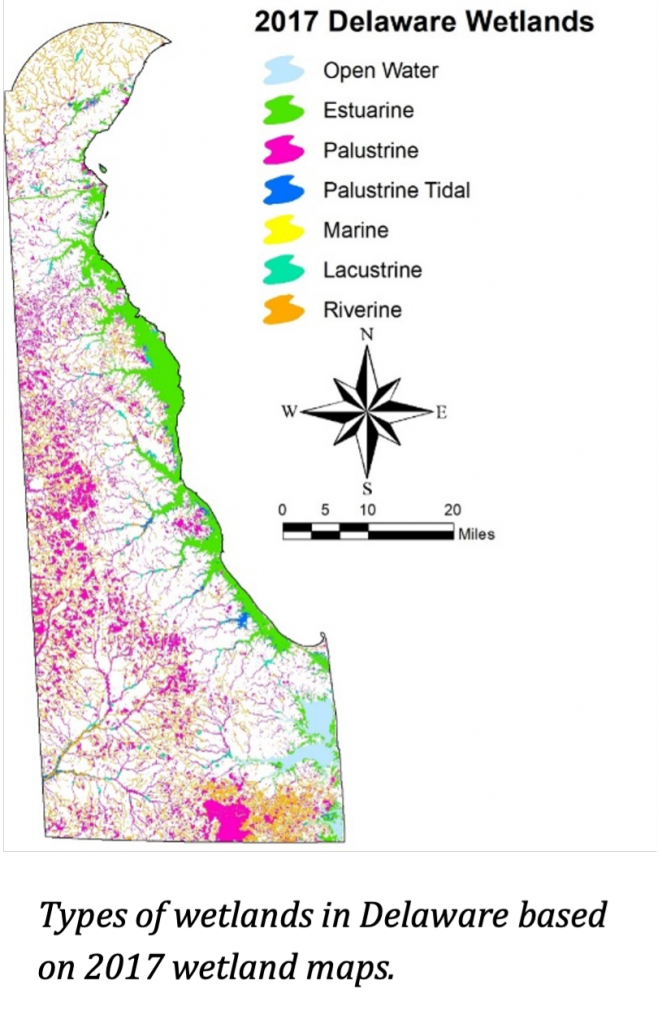
Nearly a quarter of Delaware is made up of wetlands. The map on the right showcases how the locations of these areas are spread vastly across the state. With a variety of different types of wetlands Delaware has, some types are concentrated in certain areas over others.
Non-tidal wetlands
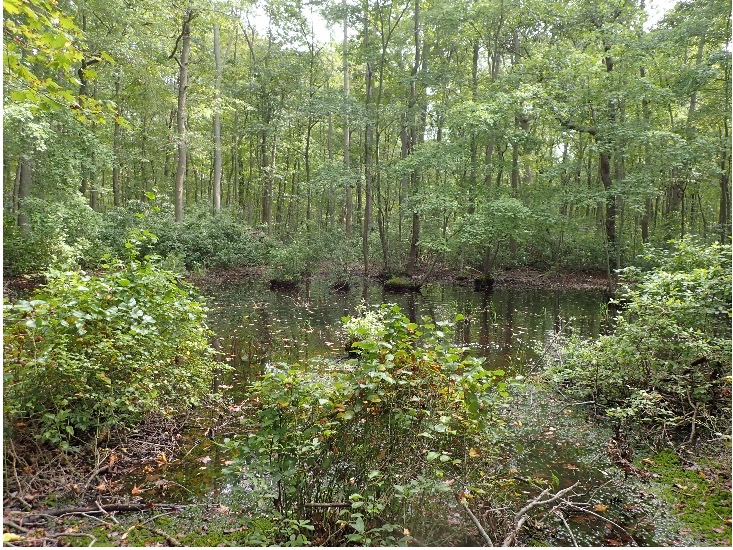
Over half of all wetlands (52%) in Delaware are non-tidal freshwater wetlands, also known as non-tidal palustrine wetlands (pink on the map), amounting to 152,012 acres. Most of those non-tidal areas are forested and occur throughout the state, though they are most concentrated in the central and western parts of the state. Aside from forested wetlands, some non-tidal wetlands are dominated by shrubs or non-woody plants such as grasses or rushes. Some, though fewer, non-tidal wetlands lack plants.
Tidal Wetlands
Tidal wetlands, including tidal saltwater (estuarine; green on map) and tidal freshwater wetlands (palustrine tidal; dark blue on map), make up 126,260 acres throughout the state, or 43% of the statewide acreage total. Most of those are saltwater wetlands – also known as estuarine – which occur along the Delaware Bay and Inland Bays and make up 90% of tidal wetlands. Many of those estuarine wetlands represent a habitat type known as low marsh, which is typically flooded at every high tide and dominated by the plant saltmarsh cordgrass (Spartina alterniflora). Fewer estuarine wetlands represent high marsh habitat, which is at a slightly higher elevation than low marsh and is therefore flooded less frequently. Unfortunately. the invasive European reed (Phragmites australis), which can be detected in aerial imagery, is present in over half of the mapped high marsh habitats.
Tidal freshwater wetlands only make up 10% of tidal wetlands statewide and occur along waterways slightly more inland than estuarine wetlands. Those areas still experience tides but are far enough away from the bay or ocean that they have fresh water instead of salt water.
Others
Riverine, lacustrine, and marine were the other categories that were mapped in the 2017 project. Each of these categories only make up very small proportions of total statewide acreage. Riverine wetlands (orange on map) make up just 3% of the statewide total and represent streams or rivers all over the state. Marine wetlands (yellow on the map) only make up less than 1% of statewide total. These are rocky or sandy shorelines right along the Atlantic Ocean in southern Delaware. Lacustrine wetlands (aqua on map) represent 2% of statewide total. Those wetlands are ponds or pond edges, and are scattered all over Delaware. Open water, including large waterbodies of the Inland Bays, was not included as a part of the 2017 wetland mapping effort, though it is illustrated on the map in light blue.
Are we gaining or losing wetlands in Delaware?
In addition to looking at current wetland acreage status in Delaware, WMAP also examined wetland losses, gains, and wetland type changes that occurred between 2007 (the year the last mapping effort occurred) and 2017. Stay tuned for another blog post coming soon that will cover these topics!
Note that the mapping layers discussed here represent biological wetlands and do not serve as regulatory or jurisdictional boundaries. Contact DNREC’s Watershed Assessment Section with questions or issues accessing or using these data at (302)-739-9939.
Delaware's Governor
State Agencies
Elected Officials
General Assembly
Delaware Courts
State Employees
Cities & Towns
Delaware State Code
State Regulations
Business First Steps
Phone Directory
Locations Directory
Public Meetings
Voting & Elections
Transparency
Delaware Marketplace
Tax Center
Personal Income Tax
Privacy Policy
Weather & Travel
Contact Us
Corporations
Franchise Tax
Gross Receipts Tax
Withholding Tax
Delaware Topics
Help Center
Mobile Apps
E-mail / Text Alerts
Social Media

Built by the Government Information Center
©MMXVIII Delaware.gov

