Facebook Twitter Instagram YouTube

Written on: December 9th, 2020 in Wetland Assessments
Guest Student Writer: Sandra Demberger, M.S., recent graduate,
Villanova University
Boaters, kayakers, and bird watchers are drawn to salt marshes for their quiet beauty. Wildlife, ranging from great blue herons to tiny fiddler crabs, and marsh grasses rustling in the soothing breeze, all draw recreators to these coastal systems. But did you know, these seemingly tranquil systems are hard at work providing valuable ecosystem services?
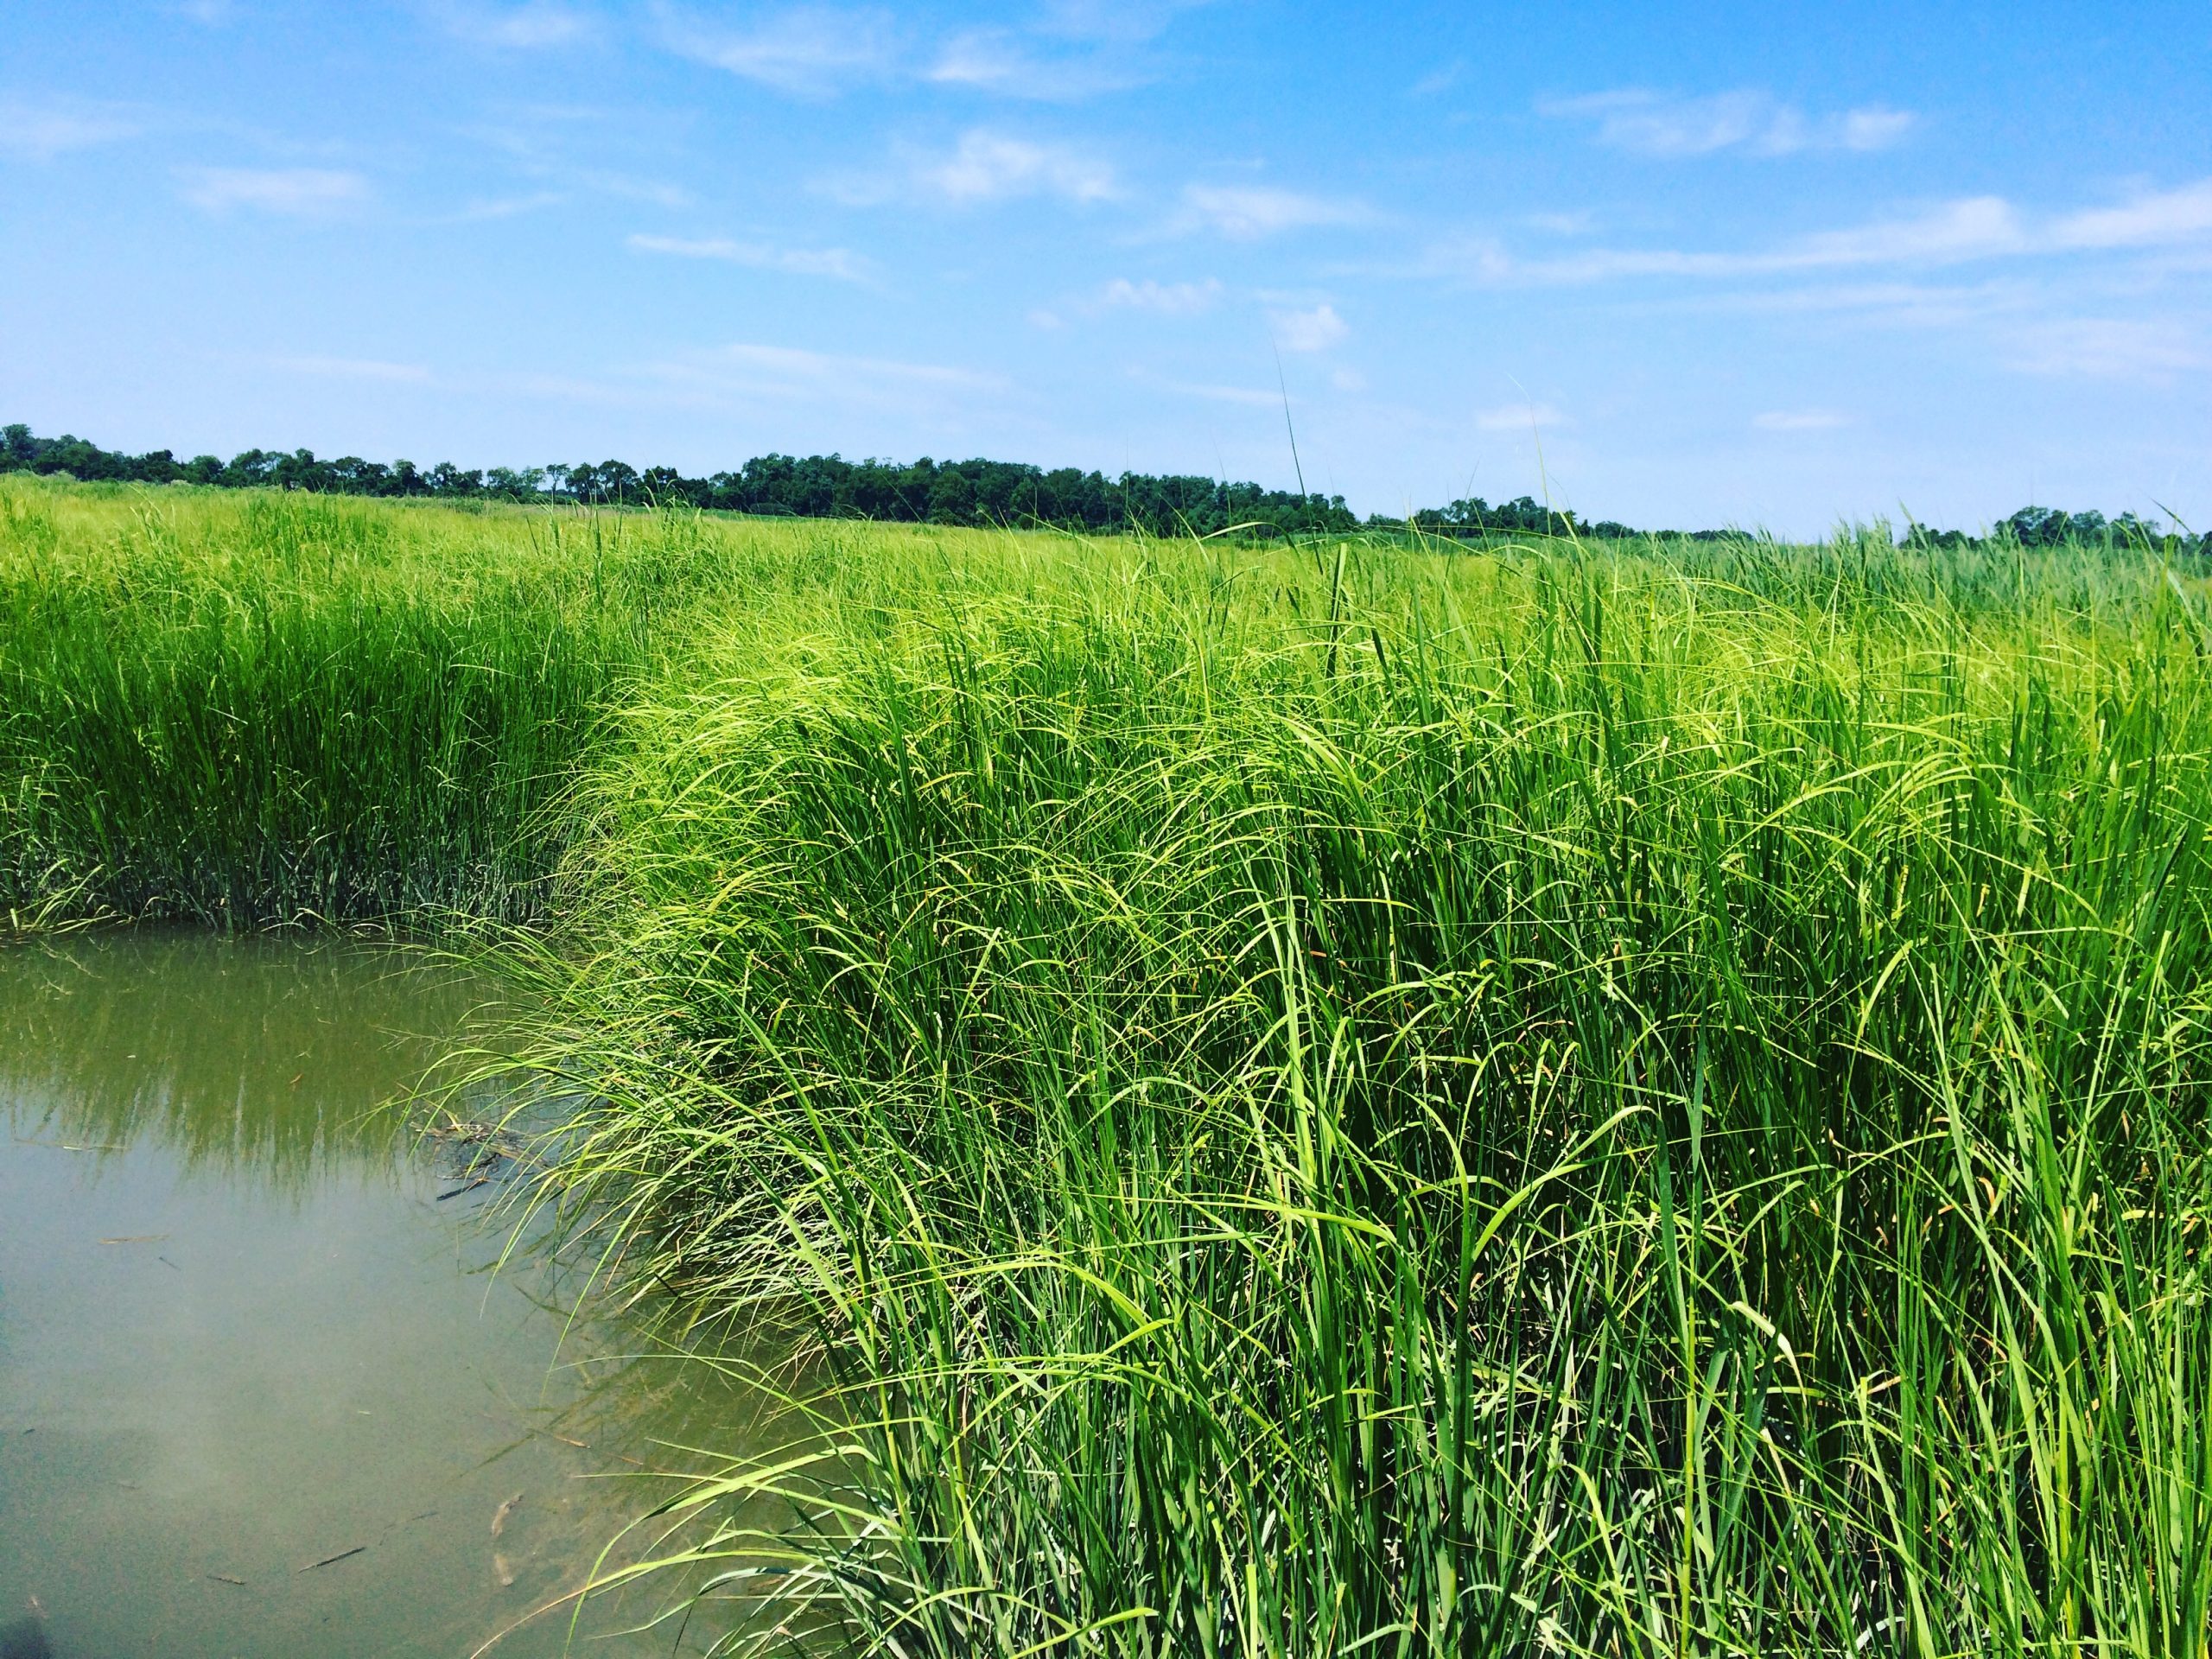
A tidal wetland in the Delaware Estuary.
An ecosystem service is a natural process that contributes directly or indirectly to the well-being of the human population¹. Salt marshes provide many ecosystem services. Some of these services include coastal protection from storm events, water filtration, and nursery habitat for economically important fish species. Additionally, scientists increasingly recognize salt marshes for their role in removing carbon from the atmosphere and storing it long-term in their soils. That process is called carbon sequestration.
All these valuable services are provided by the marsh free of charge!
Carbon dioxide is a major contributor to global climate change because it functions as a greenhouse gas. Greenhouse gases trap heat in our atmosphere, much like a garden greenhouse does. Consequently, these gases warm up our planet at an unnatural pace. This process results in what is commonly referred to as global warming, and, in turn, global climate change (a shift in climate as a result of warmer temperatures). Unfortunately, all of us are releasing carbon dioxide into the atmosphere by doing daily activities like driving our cars and heating/cooling our homes.
While we humans are putting carbon dioxide into the atmosphere, salt marshes are working hard to remove it!
Carbon sequestration is a valuable ecosystem service, naturally removing carbon from the atmosphere and locking it away in plant material for generations. While many ecosystems can sequester carbon, salt marshes have proven to be the experts. Salt marshes can sequester carbon at rates 10 times higher than other terrestrial wetland systems². Less carbon in the atmosphere means less greenhouse gases, and, ultimately, reduced global warming.

Beautiful tidal wetland in the Delaware Estuary.
Carbon sequestration is a cycle with three key components: plant material, suspended sediments (think mud and sand particles floating in the water), and very slow natural sea level rise. Here is the basic carbon sequestration cycle:
1. Salt marsh plants need sunlight, water, and carbon dioxide to grow. This process is called photosynthesis. The carbon absorbed during photosynthesis is stored in the plant matter.
2. Over time, marsh plants will die and their plant matter, still full of carbon, will build up on the marsh surface. While some of this plant material will be decomposed by microbes in the marsh, a portion will remain.
3. Twice a day the tidal waters will bring suspended sediments onto the marsh surface during high tide. The still living plants will slow tidal waters, allowing suspended sediments to settle out of the water column onto the marsh surface.
4. These suspended sediments will bury the plant material (from step 2) as well as the carbon stored within it, and elevate the marsh surface.
5. Slow, natural sea level rise allows the marsh to gain elevation at a pace that can keep up. This cycle has continued over millennia to form deep carbon deposits.
Over thousands of years, this cycle has formed carbon-rich deposits reaching six meters in depth³. The rates of salt marsh carbon sequestration may vary by region due to factors like the length of the plant growing season and the amount of suspended sediments deposited on the marsh surface. Regardless of the pace of carbon sequestration, salt marshes are worth protecting for this important ecosystem service.
It is often challenging to convince non-salt marsh lovers of the importance of these systems. To many, salt marshes are buggy and muddy areas with no real use. Defining ecosystem services–in particular, their monetary value–helps people understand their importance.
Therefore, some economists have dedicated their careers to estimating the monetary value of ecosystem services. They have developed the social cost of carbon as a way to measure the monetary value of carbon sequestration in salt marshes. The social cost of carbon is the sum of all the costs of one additional ton of carbon dioxide being emitted into the atmosphere. Some of these costs may include more severe storms and wildfires, which destroy communities and reduced agricultural yields straining our food supply. The exact value may vary due to different assumptions and uncertainties about the impacts of climate change in the future (click here for more information).

Me doing fieldwork in a salt marsh in the Delaware Estuary.
My Master’s research was related to this idea of valuing ecosystem services of salt marshes. Specifically, I focused on carbon sequestration in the Delaware Estuary. I found that the Delaware Estuary sequesters over 306,000 Mg Carbon dioxide annually. In other words, the Delaware Estuary removes the equivalent of carbon dioxide emitted from 66,109 passenger cars in one year. But this is still hard to comprehend. So, let’s apply the social cost of carbon!
The Delaware Estuary prevents about $18.32 million in damages every year by sequestering carbon from the atmosphere (using a $ 59.83 social cost of carbon value). If salt marshes stopped sequestering carbon tomorrow, society could expect to endure over $18 million in damages per year. This is pretty impactful!
This basic monetary valuation, in this case just for a single ecosystem service, helps provide context to an otherwise complex natural process.
Accelerated sea level rise is a serious threat the salt marshes. Marshes unable to gain elevation at a pace that keeps up will drown and erode away. That, in turn, would cause large carbon deposits to be released back into the environment, contributing, once again, to global climate change.
Living shorelines, beneficial reuse of dredge material, and other restoration projects are essential to protecting marshes, and the large amounts of carbon stored within them, from accelerated sea level rise. Valuing carbon sequestration and other ecosystem services may help land managers and practitioners gain funding and support for these types of conservation efforts. Additionally, understanding the value of carbon sequestration, and the many other ecosystem services, may help conservationists discourage the development of retail and housing on these valuable landscapes.
References
1. U.S. Environmental Protection Agency. 2009. Valuing the protection of ecological systems and services. A report of the EPA Science Advisory Board. EPA, Washington, D.C., USA.
2. Bridgham, Scott D., Patrick J. Megonigal, Jason Keller, Norman Bliss, and Carl Trettin. 2006. The carbon balance of North American wetlands. Wetlands. 26:889–916. https://link.springer.com/article/10.1672/0277-5212(2006)26[889:TCBONA]2.0.CO;2
3. Chmura, Gail L. 2013. What do we need to assess the sustainability of the tidal salt marsh carbon sink? Ocean and Coastal Management83: 25–31. doi.org/10.1016/j.ocecoaman.2011.09.006

Written on: December 9th, 2020 in Education and Outreach
By Kate Fleming, Delaware Sea Grant
When crab pots* are lost or abandoned at sea, they remain in the water, free to continue to capture blue crabs as they are designed to do. They can also capture other animals like diamondback terrapin and summer flounder. Since derelict crab pots are not tended by anyone, the animals that become trapped inside will eventually die. As such, these forgotten pots can lead to continued and needless mortality in our ecosystem in a process called ghost fishing.
Gear loss and abandonment is fairly common in pot-based fisheries. That’s because pots are designed to be placed in the water and left alone for days at a time before being checked on. This comes with some inherent risk for accidental loss and sometimes obstacles can come up that hinder a timely return.
Here in Delaware, blue crabbing is an important commercial industry. It is also a popular recreational past-time that leads to the capture of over 1 million blue crabs each year. Could it be that we have ghost crab pots scattered across the bottom of Delaware’s Inland Bays, where only recreational crabbing takes place? Based on the work I have been doing with University of Delaware Professor, Dr. Art Trembanis, I can say with confidence that the answer is yes, yes we do.
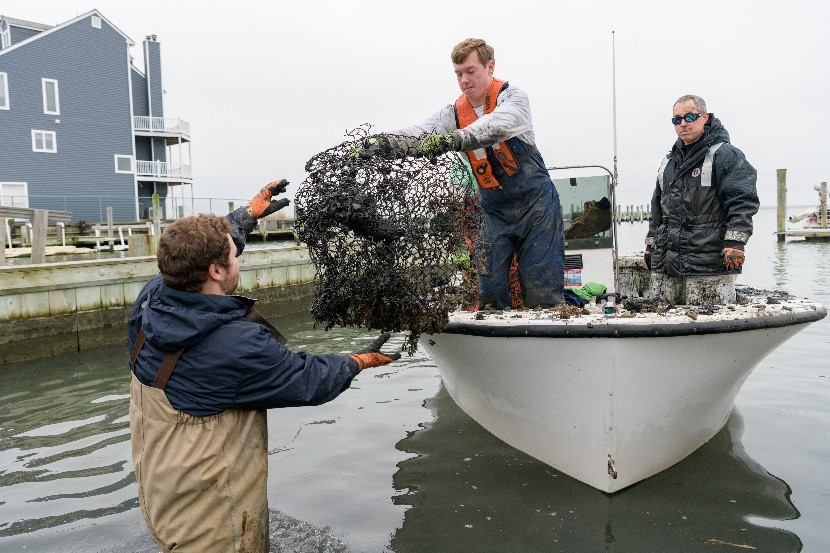
Grant Otto (graduate student in the Coastal Sediments, Hydrodynamics, and Engineering Lab) and Chris Petrone Delaware Sea Grant Extension Director) hand off a derelict crab pot (Evan Krape UD)
This shouldn’t be particularly surprising given the ubiquitous nature of this type of marine debris. However, the shallow murky waters of our Inland Bays offer an effective hiding place. Last winter** we used a commercial-grade side scan sonar to document over 560 derelict crab pots submerged beneath the surface of just under 250 acres of Rehoboth Bay. This represents some of the highest densities of derelict crab pots that have been estimated in Chesapeake Bay, which supports one of the largest blue crabbing fisheries in the nation. We followed our surveys up with a pilot removal effort. We recovered about 100 derelict crab pots in just a couple days. (Read more about our pilot removal project here!).
Today our project team has grown to include University of Delaware graduate student Jen Repp. It also includes Delaware Sea Grant’s Fisheries and Aquaculture Specialist, Dr. Ed Hale. Our sights are now set on Indian River Bay. Jen and Art are initiating side-scan sonar surveys any day now. Plus, I am in the thick of planning Derelict Crab Pot Round-Ups across three days this January and/or February 2021. The whims of the weather will determine the specific dates!
Compared to last year’s pilot project, we plan to quadruple our survey area. We will be removing 10 times the number of derelict crab pots over the next two years, aided by volunteers with boats that are willing to wield a grappling hook and help us on the water. We’ll be staging out of Holts Landing State Park and keeping our fingers crossed for flat calm seas and the balmiest of winter temperatures!
Interested in helping out? We are targeting volunteers that can bring and crew their own boats. Click here for more information and to register a team, or contact our Coastal Ecology Specialist at haywoobl@udel.edu with any questions!
If you don’t have a boat but would still like to contribute, there are a couple other volunteer opportunities that will likely come up with this project:
– We will be giving a subset of our recovered pots to the Partnership for Delaware Estuary (PDE) to be repurposed in a living shoreline experiment. Following the removal, the Center for Inland Bays (CIB) will be coordinating volunteers to transport these pots to Wilmington, DE where PDE is located. Interested volunteers can contact CIB Volunteer Coordinator, Nivette Perez-Perez at nperezperez@inlandbays.org.
– We will likely be looking for volunteer assistance to refurbish any remaining crab pots this spring or summer so that they can be reused for education and outreach. If that sounds like fun (I think it does), please reach out (haywoobl@udel.edu) and we’ll get you on the list.
One of the most common questions I get when I talk about derelict crab pots in Delaware’s recreational blue crab fishery is: Why? Why would a recreational crabber abandon their pots? Our work doesn’t actually focus on answering that question. But, I often like to point out that DNREC-Enforcement has an existing program to curb crab pot abandonment in our state. The program issues notices and then seizes pots that have not been tended within three days as is required in Delaware. They actually let me collect data through this program. It has been an outstanding opportunity to learn about recreational crab pot abandonment rates. I’ve also learned a lot about Turtle Bycatch Reduction Device (TBRD) compliance (a little more on TBRD’s below).
With that program in place, I prefer to ponder the issue of accidental pot loss. I suspect it is an important contributor to the presence of derelict crab pots in our Inland Bays. If gear is rigged with old, degrading line it can be more susceptible to breakage by rough weather or boat propellers. Likewise, buoys assembled from hollow materials are more likely to fill up with water and sink if punctured. We have recovered quite a few derelict crab pots that had bleach bottle and bumper “floats” still attached that were no longer doing their jobs.
These are accidents of course. But, I do think there are things that recreational crabbers and boaters can do to minimize the potential to lose a pot. These are things like:
-Use those white foam bullet floats in lieu of bleach bottles or bumpers
-Change out your lines each year
-Use line that sinks
-Keep your eye on the weather forecast before you set your pots
-Update your tending plan if it looks like a storm is coming or you have to go out of town
Likewise, boaters should:
-Stay vigilant for buoys on the water
-Wear polarized sunglasses to make spotting them a little easier
-Slow down and give buoys plenty of berth to avoid a line strike. The pot lines can be hard to see and are often times longer than you think.

Scutes provide evidence of diamondback terrapin mortality inside derelict crab pots (Evan Krape, UD)
Then there are things you can do to minimize impacts in the event that a pot does go missing. The first is to simply remember that the limit for recreational crabbers in Delaware is two pots per person. We know that some amount of pot loss is unavoidable. Therefore, keeping the number of pots fished to the required limits can reduce the overall quantity that end up on the Missing in Action list.
In Delaware, crabbers are required to install Turtle Bycatch Reduction Devices on all funnel entrances of a recreational crab pot. They help keep diamondback terrapins from getting inside the pots, where they will eventually drown. For more information on TBRD’s, or Terrapin Excluder Devices as they are often called, check out DNREC’s TBRD Pamphlet.
Cull rings are not actually required in Delaware. However, they have been shown to allow sublegal crabs (crabs you wouldn’t be able to keep anyway) and other small organisms to escape. They are required in some of our neighboring states, so should be fairly easy to find if you want to go the extra mile. A juvenile blue crab will thank you.
I want to wrap up by offering some acknowledgement and thanks to those that have helped us with our past and current projects. It truly takes a village.
Delaware Sea Grant provided the seed funding to get our initial side-scan sonar surveys going to confirm the prevalence of derelict crab pots in Rehoboth Bay. We received additional funding from the University of Delaware School of Marine Science and Policy. Subsequently, we have received funding from Delaware Coastal Programs and the NOAA Marine Debris Program.
Delaware Coastal Programs and several sections within the Delaware Division of Fish and Wildlife (Enforcement, Fisheries, and Wildlife) have provided support to this project. They have provided a boat and labor on clean-up days, permitting support, technical assistance, and more. Rehoboth Bay Marina allowed us to stage our removal at their private boat ramp. This was invaluable to being able to work in Bay Cove, behind Dewey Beach last year.
Dave Beebe with Rehoboth Bay Oyster Company and Rich King from Delaware Surf-fishing.com joined us on the water and were a big help (that is how I discovered the magic of a trash pump!). We couldn’t have done this work without the many University of Delaware staff and students that joined us from Art’s CSHEL Lab, Delaware Sea Grant, and others that simply volunteered to help. Vince Capone with Black Laster Learning has provided a lot of help to Art’s lab in the processing of side-scan sonar data.

From left to right: Jose Dominguez, Joseph Kessler, Matthew Breece, Nate Nazdrowicz, Chris Hauser, Taylor Deemer, Art Trembanis, Justin Guider, Robert Roose, Kate Fleming, Mark Lundine, Bryanna Lisiewski, and Hunter Tipton. (Evan Krape, UD)
We are looking forward to this year’s efforts. We’ve already had so much support from partners that have helped out in recruiting or have expressed a willingness to join us with field operations. In addition to partners already mentioned, thank you to the Center for Inland Bays, the U.S. Environmental Protection Agency, Delaware Mobile Surf Fisherman Club, Ducks Unlimited, Partnership for Delaware Estuary, Delaware Cooperative Extension, The Nature Conservancy. Also, thank you to all the volunteers that have reached out to express interest in helping out this winter. We’re grateful for your support and looking forward to a successful Derelict Crab Pot Round-Up!
Notes
*Commercial or Chesapeake-style crab pots are often referred to as crab traps, though crab pots is also technically appropriate. I prefer to use the term crab pots to differentiate them from recreational crab traps that have collapsible sides and are incapable of ghost fishing.
**Why do we work in the winter? Our work has to take place between December 1 and the end of February each year to coincide with the closed blue crab season. This ensures that the pots we find and remove are in fact derelict!
Written on: September 24th, 2020 in Wetland Assessments
By Alison Rogerson, DNREC’s Wetland Monitoring and Assessment Program
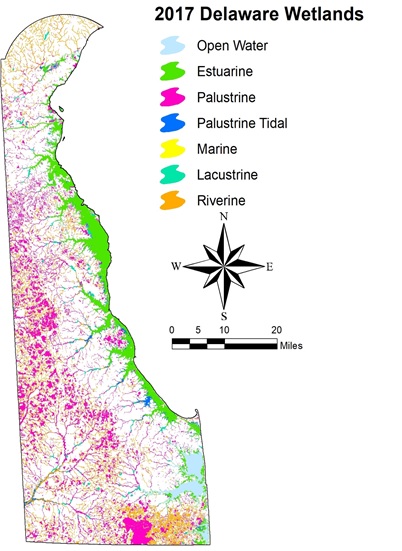
Map of Delaware’s wetlands based on 2017 imagery.
Measuring wetland health and function is a primary task for DNREC’s Wetland Monitoring and Assessment. We work on this every year, one watershed at a time. Tracking wetland acreage across the state is also vitally important to managing Delaware’s wetland. Updating statewide wetland maps is a lot of work and costly and is done every 10-15 years.
In 2017, DNREC embarked on a 10-year update of Delaware’s statewide wetland maps. These maps use a computer analysis and the best technology available to draw wetlands of all types into a GIS layer and create a census of biological wetlands. These maps are hugely important for understanding what kind of wetlands Delaware has and how they are changing over time.
After much processing and quality checks we are excited to present several new wetland layers available to the public for access. Those readers familiar with the U.S. Fish and Wildlife Service NWI Wetland Mapper should note that Delaware has been updated with the 2017 data.
Another host for accessing and downloading new wetland maps is FirstMap under Hydrology as Delaware Wetlands where there are multiple layers available:
1. 2017 Wetlands- maps all types of wetlands by two classification schemes (NWI and LLWW). This layer now also includes surface water features from the NHD layer, so streams and ditches and rivers are mapped alongside wetlands in one place.
2. Wetland Trends- this layer was created by laying the 2017 wetland map over the 2007 wetland map and noting any differences (gains, losses or changes in wetland type). Some of the losses may have been permitted or naturally occurring. Some of the changes or shifts in wetland types were caused by natural processes such as sea level rise or succession.
3. High Marsh/Low Marsh – this is a brand new layer that serves as a baseline assessment of these habitat types to help track future response to climate change and sea level rise. Low marsh habitat would typically be dominated by Spartina alterniflora. High marsh habitat is likely to be Spartina patens, Iva frutescens, or Distichlis spicata.
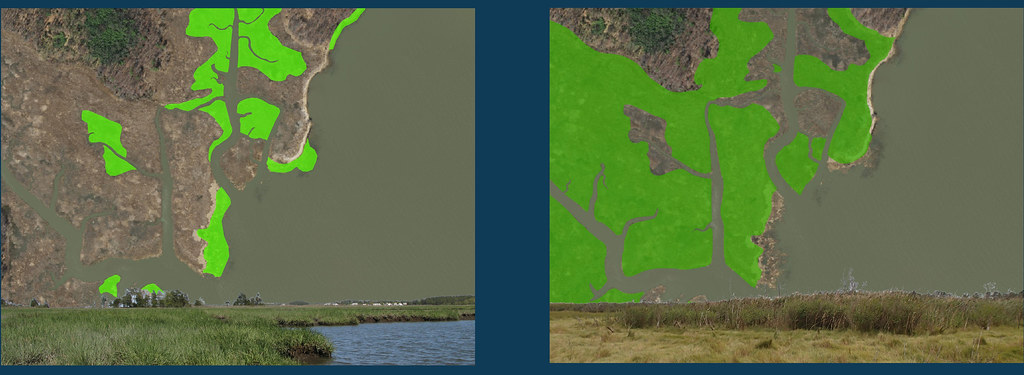
Example of low marsh (left) and high marsh (right) data sets.
4. Ordinary High Water Line – depicts high water line along the coast, generally following the high marsh upper boundary, and can be useful for landuse planning to estimate the upper extent of tidal influence.

Example of high water line layer along coast.
5. As a historic reference the 1992 Wetlands and 2007 Wetlands layers are still available online.
These mapping layers represent biological wetlands and do not serve as regulatory or jurisdictional boundaries. Contact Watershed Assessment Section with questions or issues accessing or using these data at (302) 739-9939.
Stay tuned for a story map that summarizes results from the new data and highlights the updated layers offered to the public.
Written on: September 17th, 2020 in Wetland Assessments
By Erin Dorset, DNREC’s Wetland Monitoring and Assessment Program
Most of our wetland assessments throughout the years have been in central and southern Delaware, but in the summer of 2017, our Wetland Monitoring and Assessment crew went north to perform wetland condition assessments at 116 wetlands in the Red Lion watershed. From protocol updates to navigating wetlands in a highly developed landscape, we certainly faced many new challenges. This year we finished analyzing the data from that summer, and now we can truly reflect on what we have learned!
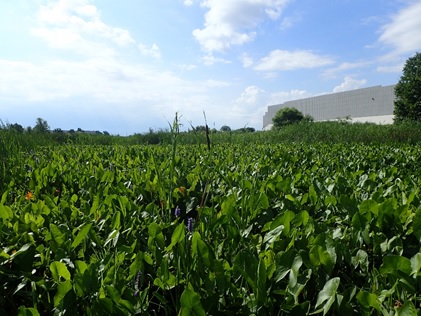
A tidal freshwater wetland in the Red Lion watershed that is bordered by industrial development.
Our tidal wetland assessment protocol (MidTRAM) was originally designed only for salt marshes. However, Delaware is also home to tidal freshwater wetlands. Tidal freshwater wetlands are inherently different from salt marshes in many ways, such as water salinity and plant community. Such differences made our original protocol inappropriate for assessing tidal freshwater marshes.
Knowing that we would encounter many tidal freshwater marshes in the Red Lion watershed, we decided to update our tidal assessment protocol to incorporate those wetlands. To do so, we examined slightly different features for freshwater and saltwater tidal wetlands. We then graded them all on the same scale and combined them into one category for tidal wetland condition analyses. We were able to pilot test our updated tidal protocol (MidTRAM v.4.1) and learn a lot more about tidal freshwater wetlands in the process!
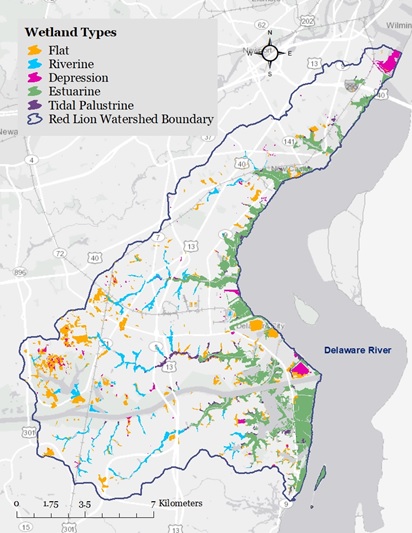
Wetland types in the Red Lion watershed based on 2007 state wetland maps.
The Red Lion watershed is in northern Delaware in New Castle county, encompassing 72 square miles. It includes part of the C&D Canal in the southern part of the watershed and Lums Pond State Park in the western part. In addition, it includes the populated areas of New Castle, Delaware City, Red Lion, and part of Bear.
In terms of land cover, the watershed is dominated by development, agriculture, and wetlands. Based on 2007 wetland maps, over half (54.9%) of wetlands are tidal, including saltwater wetlands (estuarine) and tidal freshwater wetlands (tidal palustrine). The rest of the wetlands are non-tidal flats (24.9%), non-tidal riverine wetlands (13.7%), or non-tidal depressions (6.5%). Overall, the watershed scored very poorly, receiving a D+ letter grade. Riverine and flat wetlands were in the best condition, with both wetland types receiving a B-. Depression and tidal wetlands were in much worse condition, receiving a D and a D-, respectively.
Northern Delaware is more heavily developed than most of central and southern Delaware, which is dominated largely by agriculture. This makes northern Delaware a very different landscape within which to study wetland condition. In fact, we found that development, clearing for future development, and highway construction were by far the leading causes of wetland acreage loss in the Red Lion watershed between 1992 and 2007. Most wetlands that were gained during that same time period did not have any vegetation and were surrounded by development, limiting their ability to provide useful functions.

Example of a mapped non-tidal wetland loss (outlined in green) to development between 1992 (left) and 2007 (right).
As of 2017, the only other watershed that we had assessed in this urbanized area was the Christina River watershed. It came as no surprise to us that the Red Lion watershed was very similar to the Christina River watershed in terms of overall wetland condition. We found that 21% of wetlands were minimally stressed, 36% were moderately stressed, and 43% were severely stressed. The Red Lion and Christina River watersheds both had the highest proportion of severely stressed wetlands of any other watersheds that we’ve assessed.
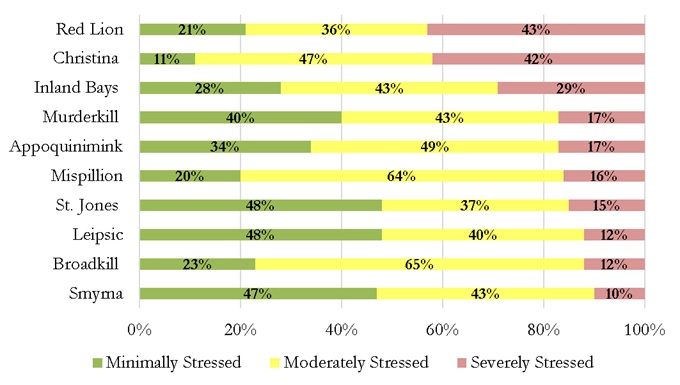
Wetland condition comparisons among watersheds in Delaware.
One of the most widespread problems that we observed across all wetland types in the Red Lion watershed was the lack of natural surrounding land, or buffer. Development, roads, mowing, and other disturbances were commonly found in landscapes surrounding Red Lion wetlands. Without natural buffers, wetlands are more likely to experience issues like pollution and lack of suitable wildlife habitat. Tidal wetlands will also be unable to migrate inland as sea levels rise.
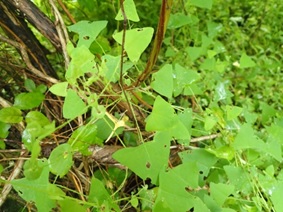
A flat wetland in the Red Lion watershed covered in the invasive plant mile-a-minute.
Like we have seen in many other watersheds, all wetland types in the Red Lion watershed suffered from the presence of invasive plant species, such as the European reed (Phragmites australis) and Japanese honeysuckle (Lonicera japonica). Invasive plants crowd out native plant species and reduce habitat value for wildlife that rely on native plants.
Many tidal wetlands also suffered from things like low plant species diversity and low marsh stability. Some non-tidal flats were ditched, causing water levels in those wetlands to be lower than they would be naturally. Numerous depressions contained nutrient indicator plant species. This suggests that many depressions may have had unnaturally high levels of nutrients within them from pollutant sources.
As you can see, wetlands in the Red Lion watershed are in poor overall condition and they need your help! You can manage invasive species on your property so that they don’t expand into nearby wetlands. If you need help identifying plant species, you can download the Delaware Wetland Plant Guide for free! Other important things that you can do are to preserve or restore wetlands and wetland buffers on your land. You can also incorporate nature-based landscape designs where appropriate, such as living shorelines, rain barrels, or rain gardens. Additionally, you can help curb effects of pollution by limiting use of fertilizers and pesticides on lawns and gardens, washing cars on grass, and properly disposing of pet waste and chemicals.
Want to know more? Check out our newly released Red Lion Watershed Report and Report Card!
Written on: September 17th, 2020 in Education and Outreach
By Amanda K. Pappas, Delaware State University

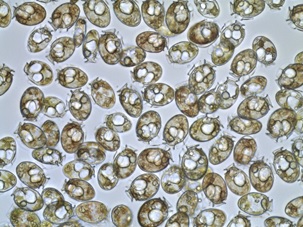
Dinophysis acuminata preserved in Lugol’s iodine solution. Photo taken during the National Center for Marine Algae and Microbiota Harmful Algae Taxonomy Course at Bigelow Laboratory.
Dinoflagellates are a group of microscopic, mostly unicellular aquatic protists that are members of the plankton community. They live in fresh and marine waters, spanning the tropics to the arctic. Fossil records of dinoflagellates exist that are hundreds of millions of years old, so they have had some serious time evolving to their environments and the diversity of adaptations within the group showcases that.
Dinoflagellates are defined by two whip-like appendages they use to move called flagella. One wraps around the body for propulsion and the other extends out from the body for steering. The “brain-like” organelle of the dinoflagellate cell, the nucleus, is relatively large compared to those found in other unicellular creatures and looks like a human fingerprint. Dinoflagellates have a distinguishable cell covering known as a theca that is either “naked” for some or covered in an armor of cellulose in others.
Most are benign and mind their own business floating around providing food and oxygen to all, but some have the bonus of an ability to produce toxins. Toxin production in dinoflagellates is thought to be a means of avoiding predation and can be so potent they can cause illness in humans. This is an area our Dinophysis makes its debut.
The genus Dinophysis consists of more than 100 species and they are too small to see without a microscope; 165 Dinophysis acuminata (D.a.) cells lined up “top to bottom” can fit across the diameter of your trusty #2 pencil eraser. In the 1970s another member of this genus, Dinophysis fortii, was identified as the culprit for sickness linked to contaminated shellfish in Japan through its production of toxins: okadaic acid and derivatives. The shellfish beds had to be shut down to harvests and this invisible miscreant has become a specimen of study almost everywhere.
In 2008, Texas experienced a similar situation Japan had, and the culprit that time was D.a. The economic hit communities take by closing recreational shellfish harvesting sites even for a season can lead to millions of lost dollars in lost venue. Areas with shellfish aquaculture industries are especially vulnerable and closures could lead to economic collapse for some areas reliant on the seasonal consumption of shellfish by tourists and national or worldwide sales.

2016 DSP World Map from the US National Office for Harmful Algae Blooms https://hab.whoi.edu/maps/regions-world-distribution/
The toxins produced by some members of the Dinophysis group lead to an illness known as Diarrhetic Shellfish Poisoning (DSP); can you guess the major symptom of the illness? Diarrhea along with other uncomfortable symptoms (i.e. pain, cramping, vomiting, chills, fever) occurs following consumption of filter feeding shellfish such as mussels, clams, scallops, cockles, and oysters that have accumulated okadaic acid in tissues. DSP toxins also promote tumor growth and may increase gastrointestinal cancer risk in humans with prolonged exposure. DSP toxins are not degraded by cooking and poisoning usually comes on quickly, within 30 minutes to a few hours after consumption and symptoms last 3-4 days. Symptoms can be severe or not and may go unrecognized as DSP poisoning due to the nonspecific symptoms in less severe cases. Aren’t you glad someone is keeping track of these things?
Dinophysis acuminata in culture. (Photo by A. Pappas and A. Williams, 2018)
My study site is in the Delaware Inland Bays, a group of shallow water bodies in south- eastern Delaware, with a flourishing oyster aquaculture industry. Torquay Canal, a dead-end residential canal up in the north- western corner of these bays, is a site with a history of D.a. bloom events. It is important to note this area is closed to shellfish harvest and no aquaculture takes place there.
D.a. is considered a harmful algae bloom (HAB) species. A bloom event of this species occurs when cell densities reach 20,000 cells per liter of water (cells/L) or more. Torquay Canal has had blooms in the millions! Whether a bloom event is harmful or not depends on the species and toxicity. Sometimes, high cell densities can be low in toxins and low cell densities may be high in toxins. Prey consumption, location, and strain all seem to influence toxin production in D.a. Increases in cell densities are known to occur due to increases in nutrient runoff (nitrogen and phosphorus) from land via fertilizers, faulty septics/sewage, and industrial discharge. Changes in wind direction, sunlight, temperature, and prey availability also contribute to increases in cell densities of D.a. Bloom events typically occur for this species at my study site during the spring and summer. I wanted to know if they were still there in the winter.
Some dinoflagellate life cycles involve a stage where the cell can encyst, creating a sort of encapsulation that allows the dinoflagellate to enter a state of dormancy quiescence during times where adequate resources are not in abundance, most often during winter months. These cysts are deposited in sediments, and act as inoculum to can start up future bloom events, and can be carried to other locations through wind and wave action. Whether or not D. acuminata produces cysts is not known; no one has seen one yet. So, I sought to answer, or at least scratch the surface, of a related question: Is D. a. present within the sediments of Torquay Canal during winter months?
I started by collecting sediment and water samples at Torquay Canal every month for two years. The water samples I took for nitrogen and phosphorus analysis. Every time I sampled, I recorded information about the current water condition, like temperature, dissolved oxygen, pH, and salinity. Dinoflagellate cells are packed with DNA, so instead of looking for something no one has ever seen, I extracted DNA from sediment samples using a chemistry kit made just for the application.
After I had my DNA, I used a common molecular method called PCR (Polymerase Chain Reaction) to determine if the DNA I extracted belonged to Dinophysis. Basically, you add DNA to a mixture of enzymes, reagents, and known segments of DNA you can purchase from a laboratory. The known segments are called primers and they bind to either side of the DNA segment you are attempting to replicate that is unique to the organism you want to determine the presence of. The mixture is heated up to break the double stranded helix of DNA in two strands and the primers and reagents all do what they naturally do: breaking, binding and copying through the heating and cooling. The process continues until billions of copies of the DNA segment you are looking for end up in your little test tube or not. It’s chemistry!
Then comes a trip to the post office to send out the samples to a sequencing lab to make sure you have what you aimed for. The sequencing lab can determine the amino acid profile of your PCR product so you can check that to a database for accuracy. Yes, there are databases full of DNA profiles for all kinds of organisms!
I am now analyzing results to determine if there are correlations between the results of the sediment analysis and nitrogen and phosphorus data. The information obtained through this project will strengthen the harmful algae monitoring program in Delaware and add to the limited knowledge of D. a. within the Delaware Inland Bays. I am looking forward to the mysteries we will uncover about this amazing creature!
Acknowledgements:
This project is directed by Dr. Gulnihal Ozbay (Advisor) at Delaware State University and Dr. Kathy Coyne at Delaware Sea Grant.
The NOAA LMRCSC provides funding for this project and is supported by the National Oceanic and Atmospheric Administration Educational Partnership Program with Minority Serving.
Institutions award NA 16 SEC 4810007. The USDA provided funding for this project under the USDA NIFA Capacity Building Grant Award 201606642. Delaware Sea Grant provided funding for this project under award R/HCE 32.
Dr. Ed Whereat (The University of Delaware Citizens Monitoring Program), Amanda Williams, Detbra Rosales, and Jen Wolny contributed to this project.

Written on: May 18th, 2020 in Wetland Animals
By Elisa Elizondo, University of Delaware
Colloquially known as marsh hens, the Clapper Rail (Rallus crepitans) is a vocal inhabitant of saltmarshes across the eastern coast of the United States and down into the Caribbean. Many of the first in-depth observations of Clapper Rail occurred in the mid-Atlantic, and in Delaware, Brooke Meanley documented much of their ecology. The northern Clapper Rail populations, including Delaware, have been declining based on extensive survey work conducted by the Saltmarsh Habitat Avian Research Program (SHARP).
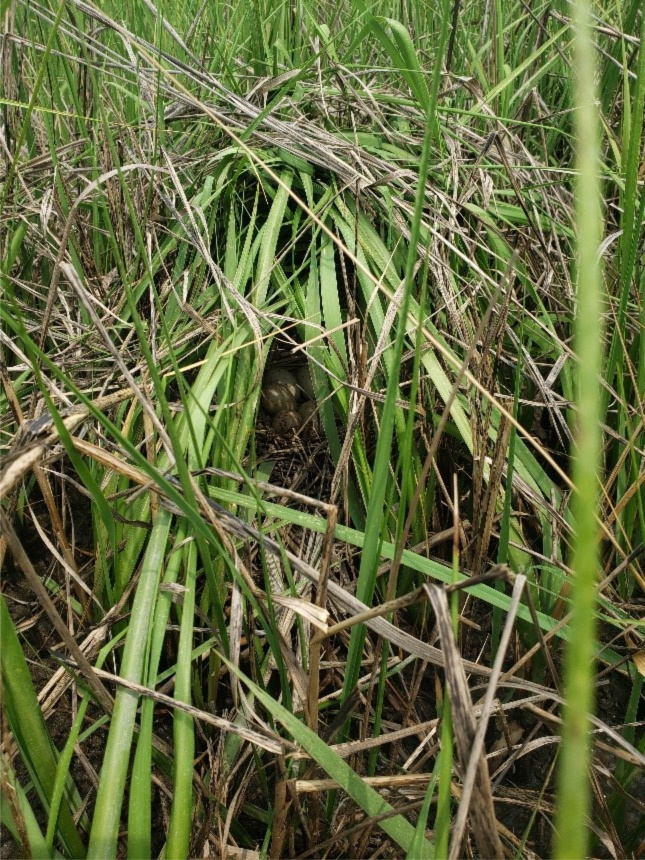
Rails are typically secretive in nature, making their populations very difficult to monitor. One important measure of population health is nest survival, as the rate at which nests survive determines the number of offspring that can be produced to join the population in the following year.
Beginning in 2018, research conducted through the University of Delaware has been monitoring Clapper Rail nests in Delaware. Locating the nests can be tricky and is accomplished by searching on foot and using thermal imaging taken from a drone. Once a nest is located, the eggs can be floated in a container with freshwater to help determine their age. As the eggs develop, gas builds up within the egg ultimately causing it to float. When the eggs are close to hatching, they will float right to the top!
Often in the early stages of the nest, the adult rails are not spotted. When the eggs initiate hatching, however, the adults are at their most defensive. Both the male and female Clapper Rail incubate the nest and tend to the chicks. They employ various techniques to protect their nests including loud vocalizations, using their wings to appear larger, or feigning injury in the hopes of drawing off the predator. The chicks are ready to run into the marsh 1-2 hours after hatching, but currently there is no information on how many of those chicks make it to adulthood.

In order to learn more about adult Clapper Rail survival and habitat use, the University of Delaware research crew is deploying GPS tags. These tags can be programmed to take GPS points throughout the day. Those data are then either sent to a satellite then downloaded online or downloaded manually by getting close enough to a bird to transmit the data to a handheld device (the download method varies by tag model).
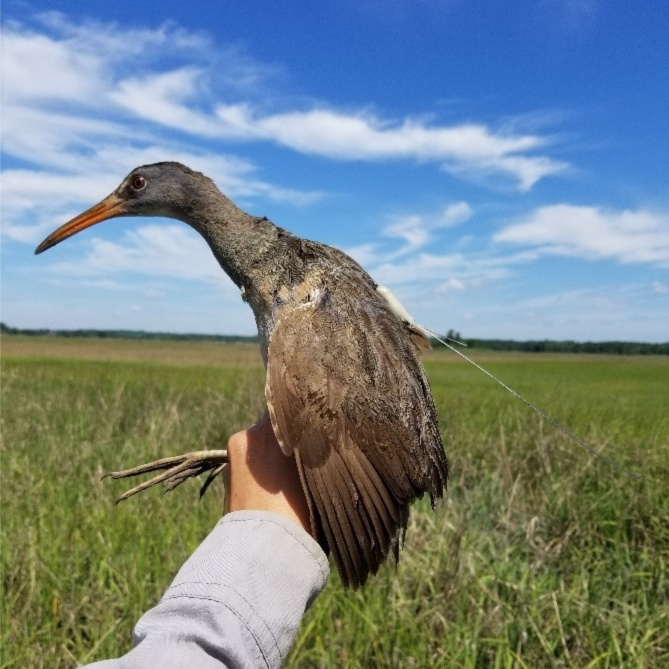
Each tag can provide hundreds of locations that we can use to determine their territories. This helps us to determine what areas each individual bird is using and the overall types of habitat the birds seem to prefer. The satellite tags can continue to transmit for several years to help identify where the birds migrate to as well.
These data can sometimes yield surprising new information; in 2019 we discovered a tagged male bird with two nests ~5 m (approximately 16 feet) apart within his home range! Blood samples were drawn from both the adult and several chicks from the nests so that paternity can be evaluated in the lab.
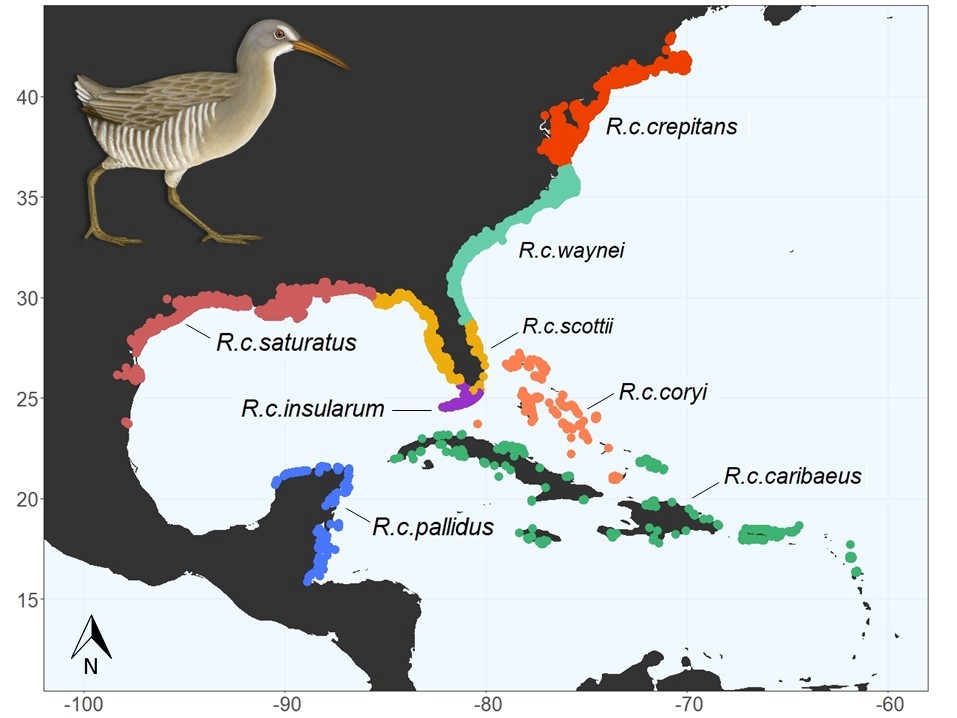
There are 8 subspecies of Clapper Rail, and only the Northern Clapper Rail (R. c. crepitans) migrates. Here in Delaware, hunting band records from the 1950s and recent satellite data from birds tagged in Delaware indicate that Clapper Rail from Delaware winter in South Carolina and surrounding states. Understanding the population connectivity, or the degree to which populations interbreed, is important in determining population trends and areas of high conservation concern.
To determine the relationship of Clapper Rail in Delaware to other regions, blood samples are currently being collected from all tagged birds. Through collaborations with other state agencies and academic partners, additional samples will be collected from across the U.S. range of these subspecies to assess population connectivity using Next Generation Sequencing techniques. Given that Northern Clapper Rail populations seem to be in decline, it is increasingly important for us to understand how their populations relate to non-migratory subspecies.
This research is made possible by many funding resources, including the Delaware Department of Natural Resources and Environmental Control, the Delaware Ornithological Society, U.S. Fish and Wildlife Services, and the University of Delaware.
Written on: May 15th, 2020 in Education and Outreach, Wetland Restoration
By Ashley Norton and Sierra Davis, DNREC’s Shoreline and Waterway Section
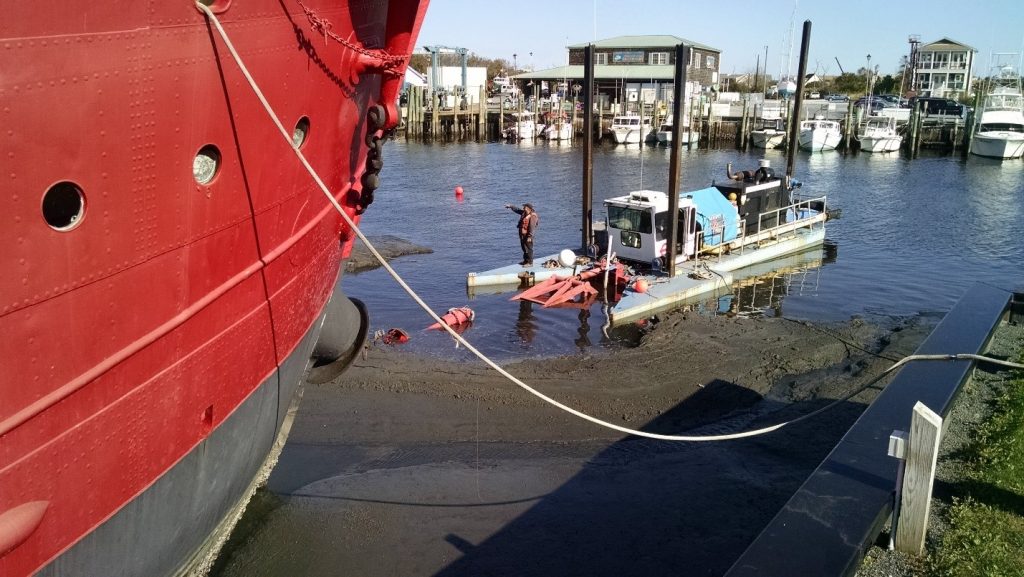
The Shoreline and Waterway Section (SWMS) manages 27 channels in all 3 counties of the State of Delaware. SWMS collaborates with WMAP to find creative and beneficial ways to use sediment dredged from waterways for ecological restoration projects (as in the Piney Point Marsh Restoration/Beneficial Use project).
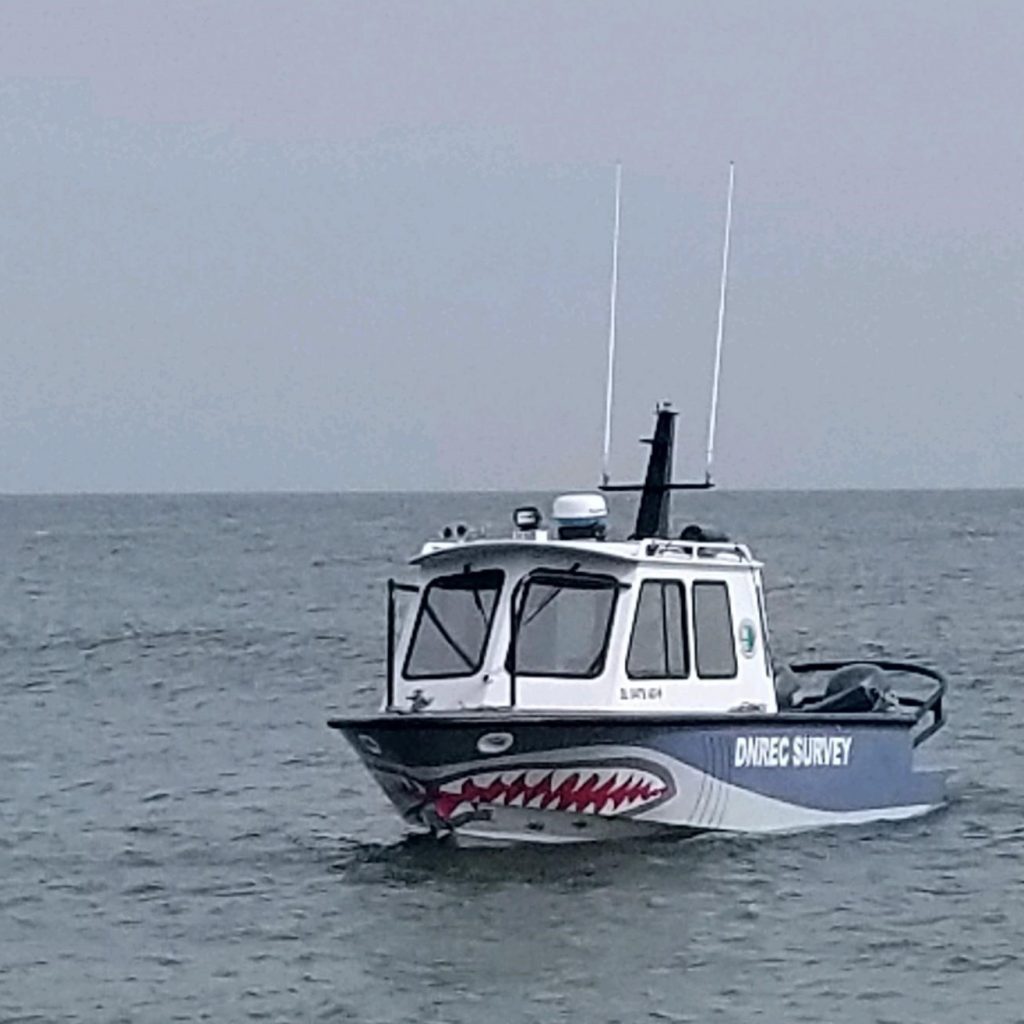
You may have seen our survey vessel and survey crew out on the water here in Delaware. This 25-foot vessel is equipped with a GPS, a sonar system to measure the depth of channels, and software used for navigation, data collection, and processing.
The sonar system on board functions like a scientific version of fish finders that you might have on your boat. The time the sound signal takes to travel from the vessel to the channel bottom and back up to the sonar’s receiver, is used to derive depth measurements. The ship’s position and motion are also incorporated and corrected for when calculating depth.
The surveys are used to determine locations to place channel markers that aid in navigation, locate and measure sediment shoals in waterways, and help with the design of dredging projects.
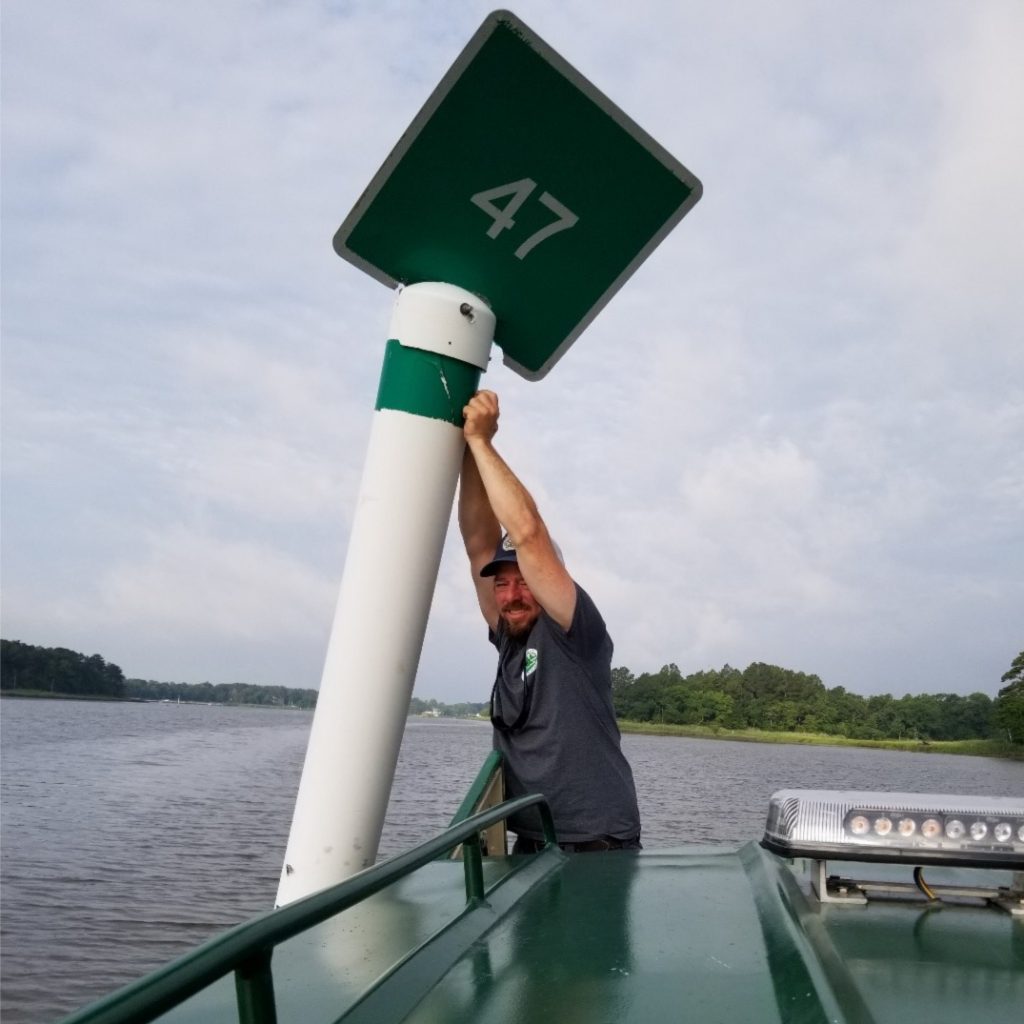
We have been marking navigational channels in Delaware’s Inland Bays since 1996. Our Section has a cooperative agreement with the United States Coast Guard to establish aids to navigation in the State’s Inland Bays channels not marked by the Coast Guard. We supplement Coast Guard markers with lighted buoys as well as PVC-pipe daybeacons.
Currently, the Section maintains almost 200 markers. Daybeacons and buoys are checked before the start of each boating season and, if needed, replaced by the Section’s channel marking crew.
Our staff on the channel marking crew are experts in working in tidal environments and using the equipment needed to place markers. We own and maintain equipment including: vessels, a hydraulic excavator, and a sectional barge – all of which are used to place the channel markers. This typically takes a 3 to 4-person team.
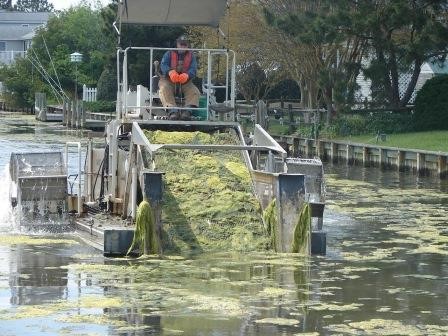
Macroalgae has become more prevalent in parts of the Inland Bays over the years as a response to increased nutrients in waterways. These nutrients come from runoff from adjacent residential and agriculture lands or domestic septic systems.
This program aims to protect, preserve, and restore natural resources in Delaware waterways by removing the excess algae growth that can become an environmental concern and cause harm.
Our Section has the capacity to operate two unique macro-algae harvesters. Harvesting helps manage large amounts of macroscopic algae located in nearshore areas. Macroscopic algae are algae you can see with the human eye, such as Ulva (or Sea lettuce).
Our Section coordinates with DNREC’s Division of Fish and Wildlife when scheduling and planning harvesting to minimize potential by-catch, such as fish, during operations.
Harvesting beneficial Submerged Aquatic Vegetation such as wigeon grass and eelgrass, is avoided because this type of growth provides good nursery habitat for aquatic species and helps to stabilize sediments.
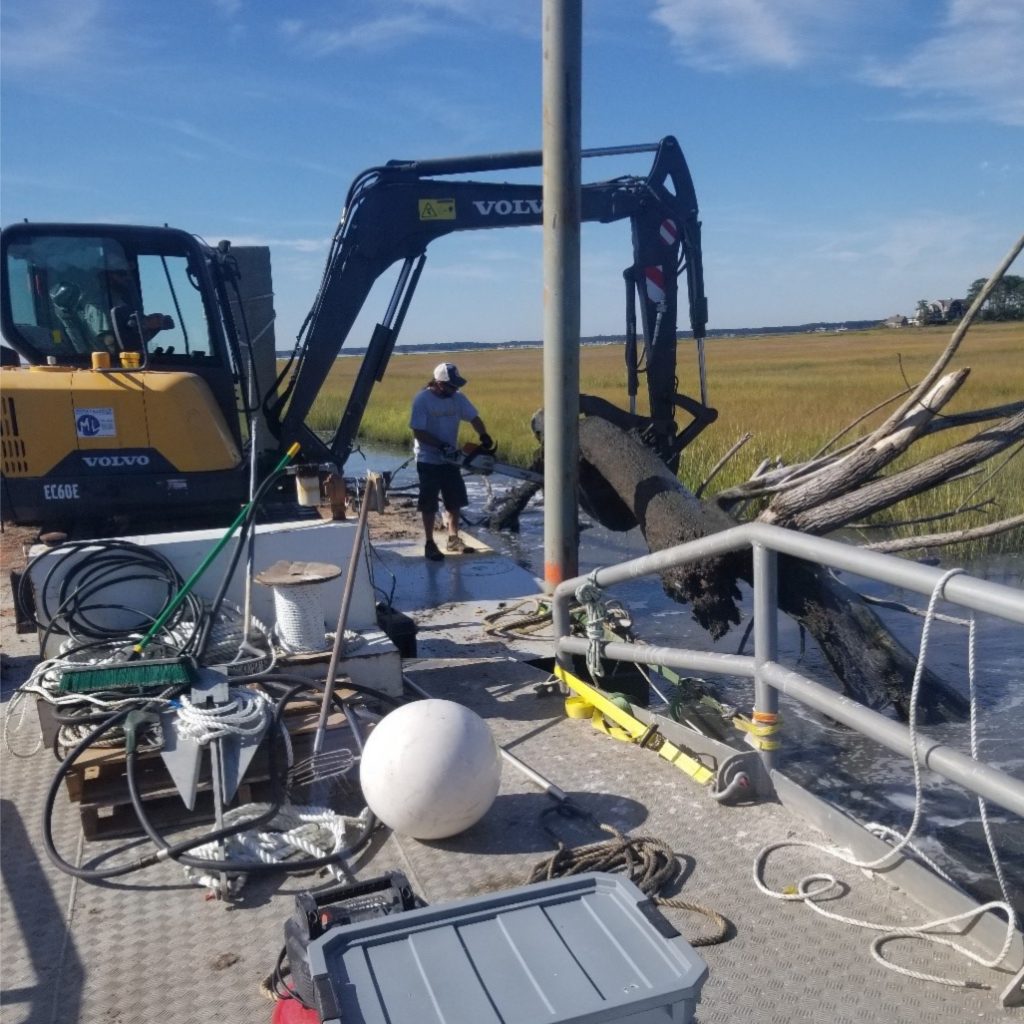
The Section owns and operates a work barge, a hydraulic excavator, and various outboard boat motors that enhance our ability to keep the state’s navigable waterways open and safe.
This equipment is used to remove abandoned vessels and derelict structures from state-maintained publicly-accessible waterways. Derelict structures might include: downed trees, ship wrecks, pilings, misplaced navigational aids, or large items of trash.
Dredging is the process of removing sediment and other material from the bottom of waterways to improve navigation. Dredging in Delaware is unique because we have a state Dredge Program that has the ability to conduct small-scale dredging operations in-house, in addition to coordinating and planning large-scale contractual operations with outside contractors.
The state currently operates two dredges that are engineered to maintain smaller waterway resources such as: channel segments, boat ramps, marinas, and state-owned lakes and ponds. In-house dredging projects include: the removal of sediment from public marina boat slips, maintaining public boat ramp depths, dredging state-owned ponds, and dredging smaller segments of channels.
Commercial dredge companies work 7 days a week around the clock and use equipment designed for removing sizeable quantities of sediment and pumping far distances for disposal. Because of this, contractual dredging is used for large-scale dredging projects in Delaware, such as the Massey’s Ditch project.
How do we decide where to dredge? We collect data and talk to our stakeholders – not only other government agencies but also the public – boaters like you! NOAA Coastal Management Fellow Sierra Davis collected a ton of data and feedback about our waterways, and has given the SWMS a way to prioritize future dredging projects. Check out her project here!
Permits are needed for dredging in Delaware. Each project must consider possible environmental effects of dredging on fisheries, water quality, and the benthic (or channel-bottom) environment.
To protect vulnerable species, dredging operations are often limited to specific months during the year. In Delaware, these environmental windows allow for dredging only in the fall and winter months. Additionally, sediment is tested before dredging begins to determine the grain size, color and presence of any contaminants to make sure that the dredging process does not stir up anything bad.
This process helps determine where sediment can be placed once dredged and that sediment can be disposed of safely. For example, if the sediment is determined to be coarse and sandy and free of contaminants, it might be beneficially used for beach nourishment.
Dredged sediment is often placed in Upland Confined Disposal Facilities (CDFs) which are diked areas of land designed to hold and safely de-water dredged sediment. The number of CDFs in Delaware has decreased over time due to facility capacity and development of upland areas as people realize the appeal of living on the water in the Inland Bays.
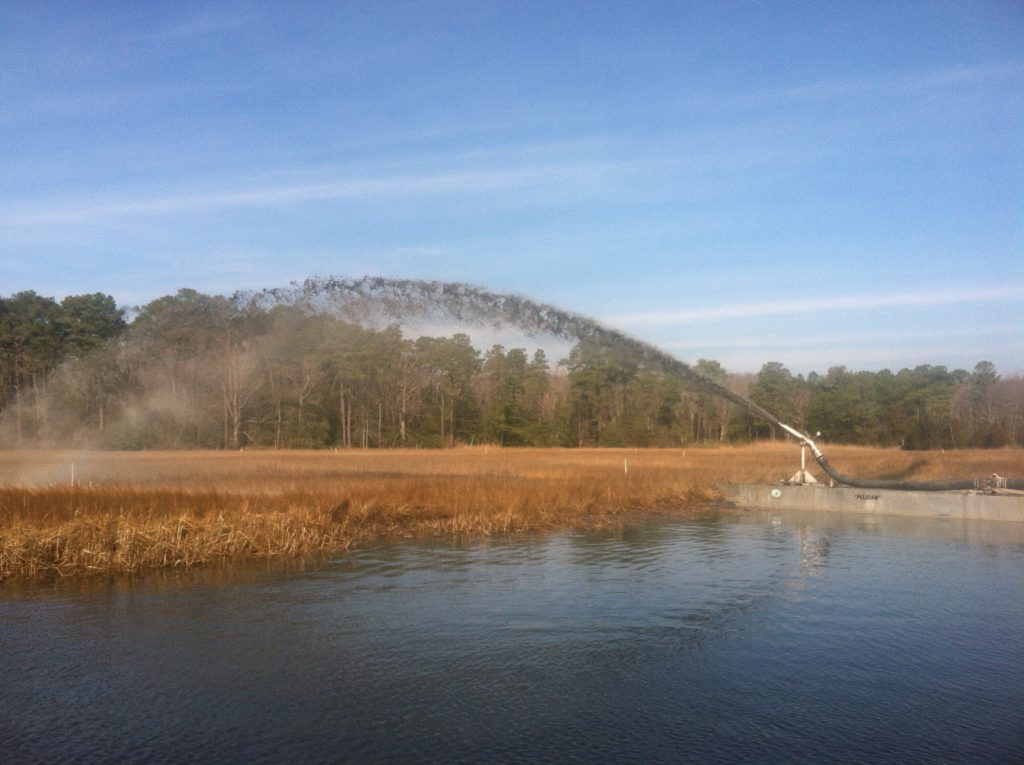
Whenever possible, it is ideal to use the sediments from a dredge project for a restoration project. Beneficial use of dredged sediment is becoming a necessary management strategy as the number of CDFs decline. Sediments themselves are also a resource and dredging practitioners such as SWMS are trying to increasingly collaborate with restoration practitioners such as WMAP to make the best use of that resource.
When dredged sediments meet certain testing standards (grain size, contaminant, color, among other testing), there can be ecological restoration opportunities that use the dredged material. These projects might include using the sediment to stabilize a shoreline, nourish a beach (such as the 2020 Massey’s Ditch project), restore an eroded marsh area, or help to protect a marsh from sea level rise (such as in the Piney Point project). With increased understanding of the environmental and restoration needs, beneficial use is regionally becoming a popular sediment management tool.
Written on: May 13th, 2020 in Education and Outreach
By Maggie Pletta, DNREC’s Division of Climate, Coastal and Energy

Delaware is known for its ability to tackle complex problems by bringing its residents together to work out solutions. Among this year’s problems: planning how the state will respond to climate change.
The impacts of climate change vary around the globe, but in Delaware, the changes we are already experiencing include increased temperatures and rising sea levels. These impacts are expected to continue or worsen. Moreover, climate scientists anticipate precipitation patterns will also change, with more frequent intense storms hitting the state. These changes will have major impacts on human health and safety, our natural resources (like wetlands), agriculture, and transportation infrastructure.
The annual average temperature in Delaware has risen 2 degrees since 1900, and the best available science projects that by 2050, the average temperature in the state will be between 2.5 and 4.5 degrees warmer than it is today. Increased temperatures directly threaten human health in a variety of ways including heat rash, heat cramps, heat exhaustion, and heat stroke. All can aggravate underlying health conditions and cause the heart, kidneys, lungs, and other internal organs to fail. But human health is not the only thing impacted by high temperature; roadways can also heave and buckle during heat waves, damaging critical infrastructure.
Records at the Lewes tide gauge indicate that sea level has risen more than a foot over the last century and are projected to rise an additional 9 to 23 inches by 2050. As sea level continues to increase a variety of impacts occur, most notably flood damage to habitats, roads, and infrastructures located in low-lying areas. Other impacts include increased erosion rates and saltwater intrusion in coastal soil and water resources that can render them unusable for agriculture and drinking water.
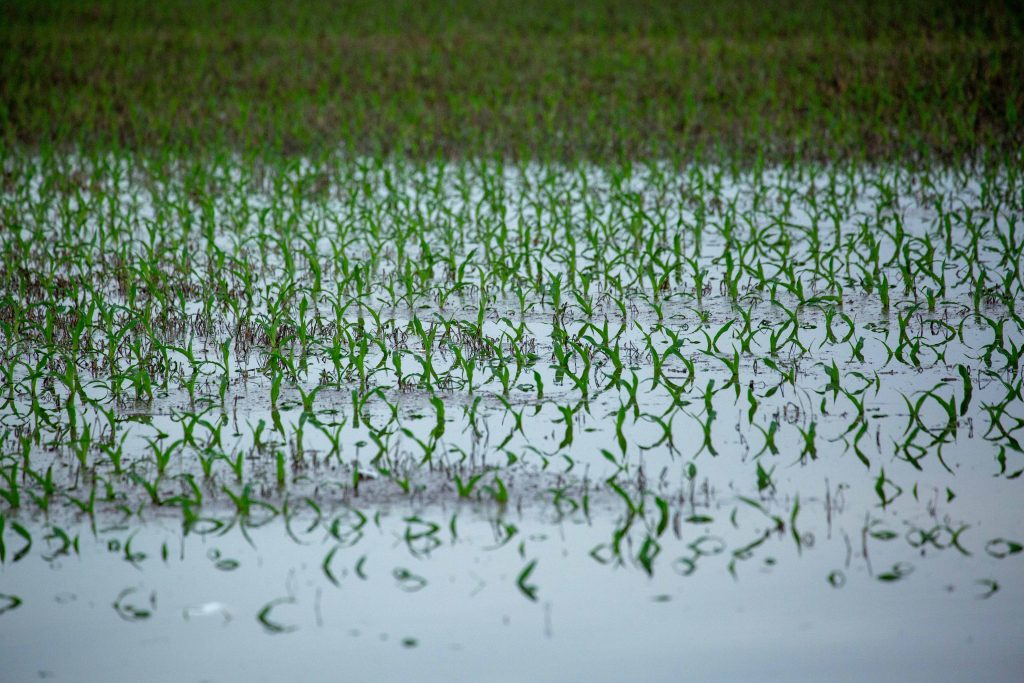
While the most recent climate trends do not show an increase in precipitation and extreme weather events, it is projected there will be noticeable changes in the future. It is projected there will be a 5% increase in average yearly precipitation and increased frequency and intensity of extreme weather events by 2050 and a 10% increase in precipitation amounts by century’s end. Changes in precipitation, including extreme rainfall events, will affect agriculture by damaging crops, altering growing seasons, and increasing crop disease pressure.
Over the course of 2020, the state is working to create the Delaware’s Climate Action Plan, a framework for how Delaware can address the causes and consequences of climate change in the decades ahead. The plan will build on years of research, plans, and commitments, such as the state’s sea level rise planning process and Delaware’s participation in the Regional Greenhouse Gas Initiative and the U.S. Climate Alliance.
The plan will map out actions to reduce greenhouse gas emissions from various economic sectors, including transportation, industry, and energy production — the three leading greenhouse gas emitters in the state.
Additionally, the plan will lay out the actions state agencies can take to support the state in adapting to climate change. These actions will be shaped by the best adaptation practices from across the world.
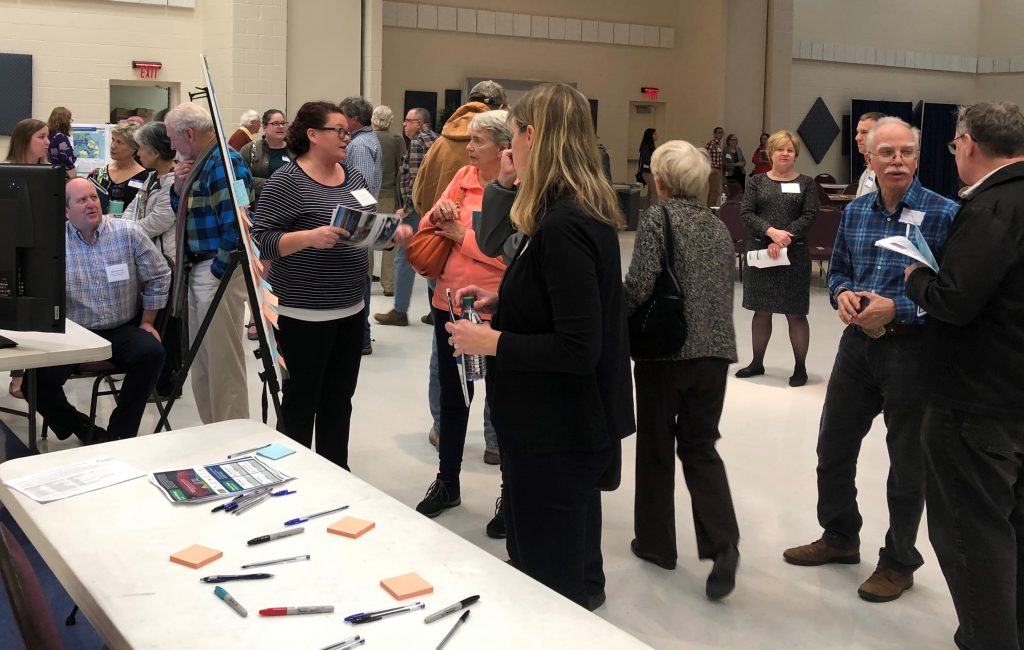
In developing Delaware’s Climate Action Plan, DNREC’s Division of Climate, Coastal & Energy (DCCE) hosted three public workshops in early March to learn of Delawareans’ experience with climate impacts and to gather input on how the state can best address the causes and consequences of climate change. More than 250 people attended the workshops.
The Division also held a technical advisory workshop in March with representatives from the transportation, buildings, energy, and industrial sectors to solicit ideas for reducing greenhouse gas emissions. Summary reports for the public and technical advisory workshops will be posted in the coming weeks on declimateplan.org.
DCCE’s Climate Action Plan team is continuing to shape the plan during these unprecedented times, working with technical consultants to put together a comprehensive greenhouse gas analysis that will examine which statewide strategies may be most effective in reducing the state’s carbon footprint.
The Climate Action Plan team is also actively engaging with stakeholders from across DNREC and other state agencies to identify possible adaptation actions these agencies can take as part of the final plan. These ideas for adaptation actions will be presented to the public later this year for feedback. Details on how to provide feedback will be posted online at declimateplan.org, on our Facebook and Twitter, and via the DCCE Newsletter.
For the plan to be successful, we need to hear from you, on what actions you want the state to take to address climate change.
You can provide feedback and your input in a variety of ways:
Also, be sure to follow our project website at declimateplan.org or our Facebook and Twitter pages for the most up-to-date information. With your feedback and support, we aim to create a plan that shapes a future where individuals, businesses, communities, and institutions can deal with extreme weather, harness clean energy, breathe fresh air, and live healthier lives.
Written on: May 13th, 2020 in Education and Outreach, Living Shorelines, Wetland Restoration
By Andrew Bell, DNREC’s Shellfish and Recreational Water Program
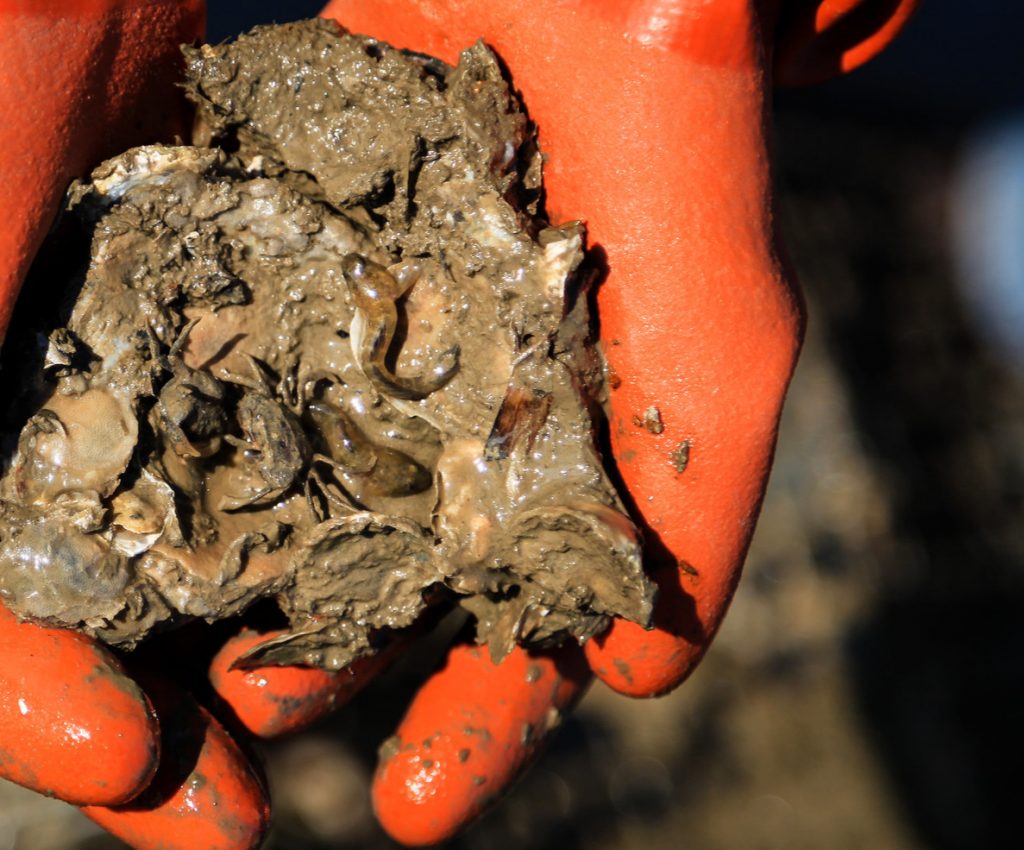
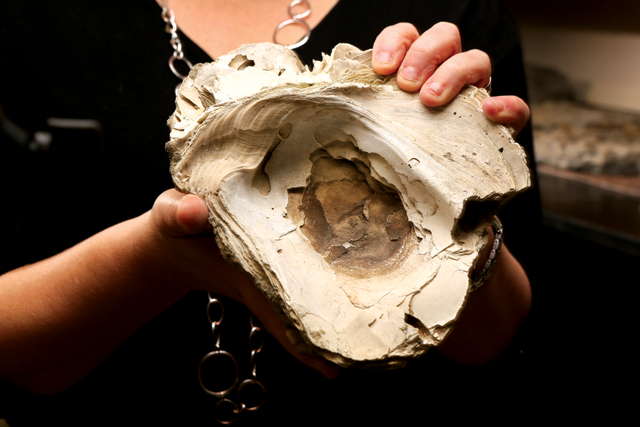
At first glance, an oyster appears to be little more than, well, a bit of goo inside a rock. But actually, the humble oyster is an environmental warrior with an impressive bag of tricks up its sleeve, and it serves as a keystone species upon which depends the health of a marine ecosystem and the surrounding marsh.
Oysters provide numerous essential ecosystem services to waterbodies and wetlands.
Let’s learn more about each of these three environmental services provided by the amazing oyster.
The most obvious of the oyster’s multiple roles in Mother Nature’s army is as a water filter. Oysters eat by pumping the surrounding water through their bodies, removing from the water bits of food along with harmful excess sediments and nutrients. A single oyster can filter up to fifty gallons of water per day. Multiply that by many millions of oysters throughout an entire waterbody, and you’ve got a contaminant-gobbling army capable of filtering an entire estuary every couple days!
This filter feeding results in clearer waters which let in more sunlight, and meanwhile the depositing of oyster feces establishes a nutrient-rich seabed. This combination allows threatened seagrasses to establish beds, in turn providing habitat for marine animals such as crabs and clams. In this way, oyster reefs ultimately support the entire marine food chain.
Further, the sequestration by oysters of excess nitrogen and other nutrients prevents harmful algal blooms, which can rapidly consume all oxygen in the water and cause mass die-offs of fish and other aquatic life. Helping with this are certain bacteria that grow in the material produced by the deposition of oyster feces, which convert nitrogen into a form unusable by the algae.
Oysters are built to clean the water, and they do so at significantly lower costs than other cleanup technologies. Unfortunately, across the East Coast, the loss of oyster populations has transformed waterbodies from clear and healthy to murky and anoxic – more on that later.
Oysters begin life as microscopic larvae that swim freely in the water before settling down on a hard surface such as rock or older shells. Now known as spat, the oysters grow into adults and fuse together into large reefs consisting of thousands of individuals. The complex three-dimensional reef structures provide essential habitat for a vast range of marine flora and fauna.
Species like mussels, barnacles, and sea anemones settle on reefs, establishing abundant food sources for fish species important to recreational and commercial harvest. Species like oyster gobies and blennies lay their eggs inside dead oyster shells to conceal them from predators. Most importantly, the innumerable nooks and crannies in an oyster reef provide shelter for marine critters, which is especially essential for juveniles in need of hiding places.
Life is not easy for baby fish and invertebrates, but oyster reefs help by buffering temperature extremes and by providing shelter from hungry predators. The presence of these organisms then attracts larger predators which in turn attract even larger predators, and in this way an oyster reef establishes its own complex and self-sustaining ecosystem. For aquatic critters, an oyster reef can be like an oasis in the middle of a desert.
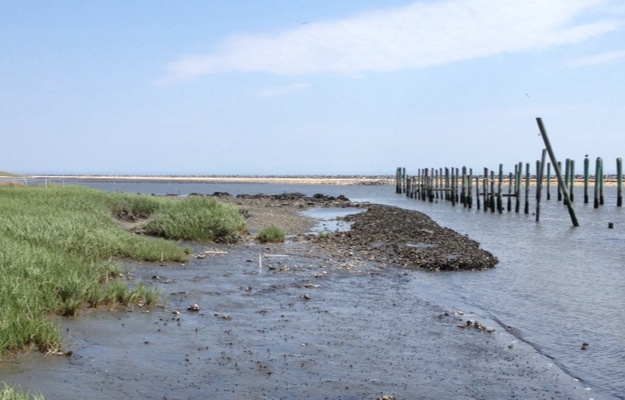
Also among the many environmental benefits of the oyster is its effectiveness as a natural breakwater – in fact, it is more effective than artificial methods. Whereas artificial breakwaters like solid seawalls only deflect wave energy, potentially just passing the problem down the coast, oyster reefs dissipate the wave energy. And unlike artificial methods, an oyster reef grows and changes naturally, allowing it to keep pace with sea level rise.
The effectiveness of a reef depends on many factors including its size and orientation, but under ideal conditions, an oyster reef will reduce up to 90% of wave energy. Oyster reefs can be especially valuable as natural breakwaters in areas where high boat traffic intensifies shoreline erosion.
The resulting calmer waters support the growth of coastal marshes and seagrass beds, which can then begin providing their own services to the ecosystem. This leads to a highly beneficial form of natural coastal and wetland protection, wherein multiple habitat types work together to maximize the benefits to the humans and animals that rely upon the coastal environment.
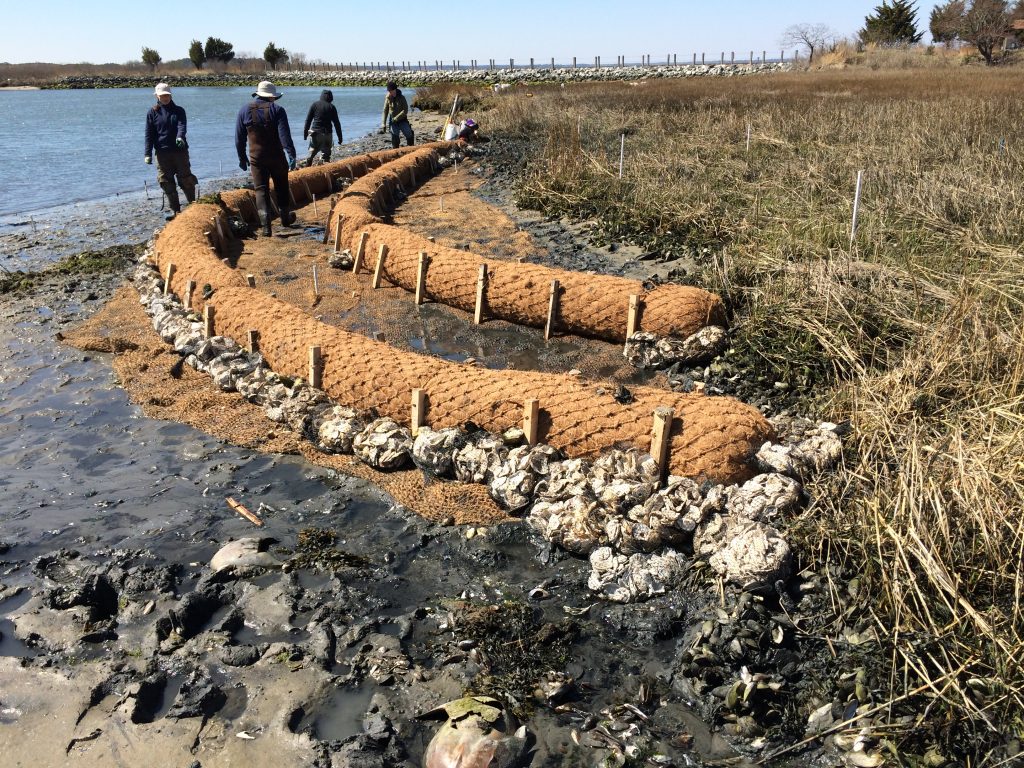
Oyster reefs are so essential to shoreline and wetland protection that empty shells are collected from restaurants and individuals by the Delaware Center for the Inland Bays and the Partnership for the Delaware Estuary. These organizations then stuff the shells into mesh bags that are placed along the edge of living shorelines projects. The resulting line of recycled shells then serves as the first line of defense for protecting the marsh edge from erosion by waves, and also as substrate on which new oyster reefs may form.
In the early 1600s, when Captain John Smith explored our region, he wrote that the oyster reefs were so numerous that the ship had to carefully navigate around them. Unfortunately, today oyster levels are at historic lows in the Delaware region and in other areas along the US coasts. By the mid-20th century, a conspiration of overharvesting, oyster diseases, and habitat degradation had devastated oyster populations, which have been having trouble recovering ever since.
Today, oyster populations are showing some hopeful signs, but the news remains mixed. As a keystone species, the devastation of oysters has resulted in waters that are murkier and more frequently anoxic, loss of important habitat, and erosion of shorelines and marsh.
Fortunately, just as the loss of oysters results in great harm to other species, the reintroduction of oysters can help those species recover. Oyster restoration is a top priority of many environmental organizations because the ecosystem services provided by oysters are so significant, varied, and long-lasting. Not to mention, oyster restoration efforts are often more cost-effective and technologically simpler than other types of projects.
Last year, the first oysters grown in the Inland Bay’s new shellfish aquaculture program were harvested and enjoyed at Delaware restaurants. Rather than being harvested from wild reefs, these oysters are grown from seed in cages. Oyster farmers lease acres of the Inland Bays from the State of Delaware, then tend to the oysters as they grow from seed the size of small pebbles to adult oysters that are then enjoyed in raw bars in Delaware and beyond.
Oyster farming is sustainable, benefitting the ecosystem by replicating the environmental services once provided by great natural oyster reefs. They filter the water of the Inland Bays, which have long suffered from excess levels of nutrients and sediments that are preventing remnant seagrass beds from expanding. They provide three-dimensional structure, transforming the flat, featureless bottom typical of the Inland Bays into complex habitat that attracts a variety of important and threatened species. In this way, they serve as replacement habitat for the seagrass beds that were once ubiquitous in bays up and down the coast, and oyster farmers have been amazed at the huge variety of critters they find in and around their cages. And the aquacultured oysters help reduce the marsh erosion, important considering the high boat traffic common in the Inland Bays.
Oyster farmers take great care to keep their products safe for enjoyment by healthy consumers. As oysters filter feed, they remove not only food particles from the water, but also naturally-occurring pathogens, which are then concentrated at rates higher than the surrounding water. As a consequence, persons with certain medical conditions should never consume oysters unless thoroughly cooked, but raw oysters are nutritious and delicious for healthy persons. DNREC works with oyster farmers to enforce regulations for shellfish harvesting and handling to prevent shellfish-borne illness.
It is hoped that the new oyster aquaculture program, along with oyster restoration efforts being spearheaded by several organizations, will help restore our state waters and wetlands through the oyster’s tremendous capacity for filtering water, providing habitat, and preventing shoreline erosion. Truly, oysters are amazing environmental warriors with a keystone role in ensuring that ecosystems stay healthy for the benefit of a range of plants and animals which includes, of course, you and me!
Written on: March 13th, 2020 in Education and Outreach, Wetland Restoration
By Kelly Valencik, DNREC’s Delaware Coastal Programs

Many communities throughout our state have already seen changes as a result of climate change- from shifting rainfall and storm patterns, to increased drought, to flooding from sea level rise. These consequences of the warming earth and ocean temperatures as a result of greenhouse gas emissions have brought long term community planning challenges to Delaware.
For example, residents in the City of Lewes, which sits next to the Delaware Bay in Sussex County, have noticed more and more disruptions to the typical rhythms of nature in their community. Now it’s not just the the big coastal storms or nor’easters that cause flooding issues, it is also the sunny day, strong or spring tides that are inundating sections of main roads that connect the downtown area to the major road arteries.
Other Delaware communities have experienced similar issues and and are looking for ways to tackle these problems now before they get worse, with the ultimate goal to reduce impacts to their residents.
The Delaware Department of Natural Resources and Environmental Control (DNREC) wants to assist municipalities and communities across the state in becoming more prepared and resilient to any change that currently appears inevitable.
Community resilience is the ability to plan for and bounce back quickly from hazardous events. In the coastal context, the focus is on planning for more frequent and stronger storms, sea level rise, and other changing climate conditions so that communities are better able to recover when the event occurs.
Communities and local governments in Delaware have the opportunity to be proactive and play a leading role in preparing and responding to the impacts of severe weather and climate change because municipalities largely have the responsibility for planning their own future through land use decisions, building codes and design, and maintenance of infrastructure such as water and wastewater systems. Using these tools, municipalities can be vigilant in protecting and safeguarding people and habitats from harm.
Green infrastructure is a nature-based approach to address environmental challenges such as stormwater runoff, coastal flooding, erosion, and water and air pollution. It uses natural processes to manage water and improve environmental quality. These natural processes include using plants and soils to:
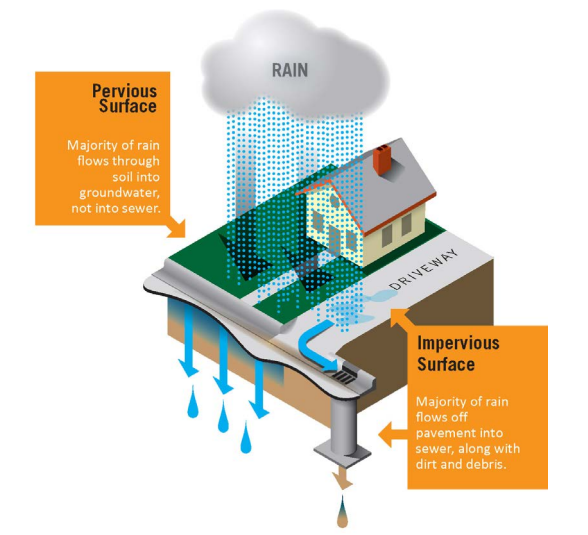
Stormwater refers to the rainwater that flows off of different surfaces after it falls to the ground. People commonly see stormwater running out of rooftop gutters and along the sides of streets during a rainstorm. The surfaces on which rainwater falls are classified into two categories:
When land is developed, pervious surfaces (water infiltrating) are replaced with impervious surfaces (solid) which allows for a larger volume of stormwater to run off into storm drains and streams. This can cause more frequent flooding and can make coastal flooding or sea level rise inundation worse. In developed areas, stormwater is also more likely to pick up pollutants like gasoline residue, animal waste, and trash and carry them into streams, bays, and the ocean.
Communities are working to improve their resiliency through the use of Best Management Practices (BMPs) to capture runoff from impervious areas, reduce flooding, and filter pollutants out of stormwater before it reaches important aquatic ecosystems, like wetlands, or recreational areas. Green infrastructure can be used in many different settings to act as a BMP that improves stormwater management and the infiltration of runoff.
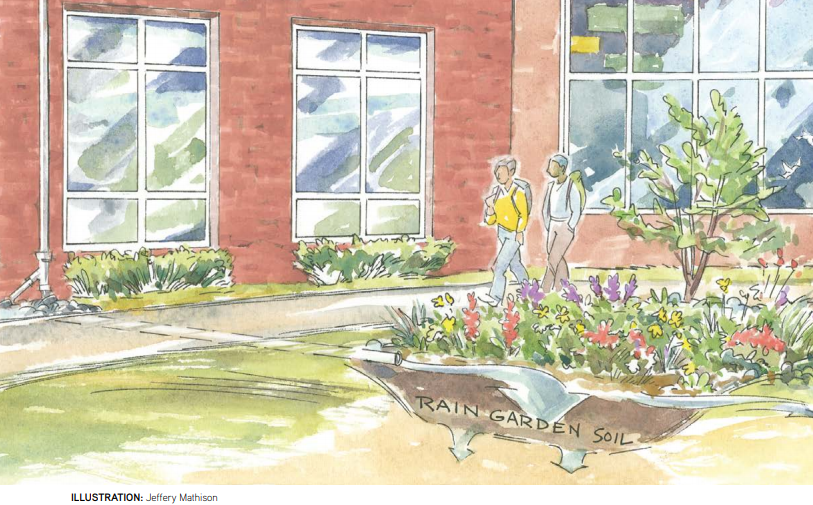
For example, trees can be used in urban, suburban, and rural settings, in plantings of one or two trees, or in a 100-foot-wide forested buffer along a river shoreline. Their root systems help absorb precipitation and filter water runoff before it reaches open bodies of water. Rain gardens can act in similar way and help manage stormwater runoff from specific areas such as roofs and parking areas, while larger expanses of conserved or restored wetlands can provide flood retention, carbon storage, and wildlife habitat.
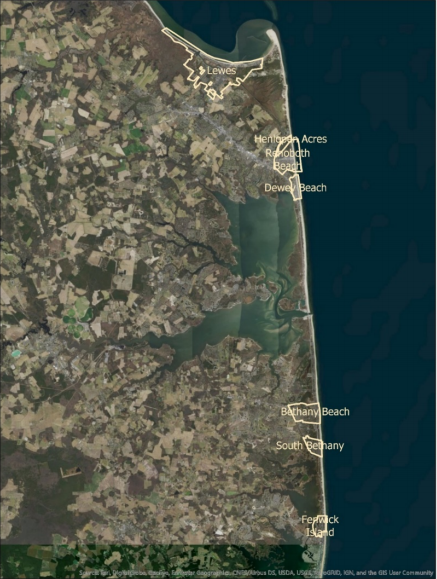
Last year the DNREC Delaware Coastal Program’s (DCP)’s Resilient Community Partnership (RCP) program worked with a group of coastal municipalities, the Cities of Lewes and Rehoboth, and the Towns of Henlopen Acres, Dewey Beach, Bethany Beach, South Bethany, and Fenwick Island, to conduct a study of impervious surface coverage. This study was done to find out what impacts the existing impervious surfaces in these cities and towns have on the stormwater management of precipitation and water quality.
These coastal communities face challenges on multiple fronts for addressing stormwater management including: tidal flooding, rapid population growth from tourism and development, a shallow groundwater table, and growing floodplain. The best path forward to consider all of these challenges to plan for their resident’s futures, was for all 7 of these communities to work together to gain an understanding of existing impervious surfaces and strategies for reducing said coverage.
Three components to this project were performed to address these multiple influences on stormwater management.
Many of the recommendations from this plan include methods of using green infrastructure at the municipal (or citywide level) and residential levels, and are now being considered for adoption in these communities. As a result, these communities are better prepared to react to address flooding and sea level rise concerns and have community specific nature-based solutions easily accessible to reduce the impact of impervious surfaces on their environment and water quality.
Delaware's Governor
State Agencies
Elected Officials
General Assembly
Delaware Courts
State Employees
Cities & Towns
Delaware State Code
State Regulations
Business First Steps
Phone Directory
Locations Directory
Public Meetings
Voting & Elections
Transparency
Delaware Marketplace
Tax Center
Personal Income Tax
Privacy Policy
Weather & Travel
Contact Us
Corporations
Franchise Tax
Gross Receipts Tax
Withholding Tax
Delaware Topics
Help Center
Mobile Apps
E-mail / Text Alerts
Social Media

Built by the Government Information Center
©MMXVIII Delaware.gov

