Facebook Twitter Instagram YouTube

Written on: December 14th, 2021 in Wetland Assessments
By Alison Rogerson, DNREC’s Wetland Monitoring and Assessment Program
In this fourth installment reviewing the results of DNREC’s ten year wetland mapping update and Status and Trends analysis, we’re digging up the dirt on wetland losses. This is likely the wetland topic with the most sensitivity. People who value wetlands are upset that they are being lost. People being accused of causing wetland losses are defensive. People who had a bad experience with wetland regulations that prevent losses feel frustrated. We’re not forensic scientists but we have the best available mapping technology on our side.
First off, how does one ‘lose’ a wetland? Where does it go? Lost is an interesting term and ‘converted’ or ‘destroyed’ may be more accurate. Wetlands exist when they have porous, spongy soils and have a connection to some source of water (rain, groundwater, overbank flooding etc.). A functioning wetland can be effectively destroyed if it becomes disconnected from its water source by a berm or a flood gate or dried out by ditching and channelizing streams. They can also be buried under loads of fill, say if someone tried to build on top of them. The compacted soils are rendered powerless to function normally. Without a water connection and functioning soils there will be no wetland plants- and the wetland is essential destroyed- or lost.
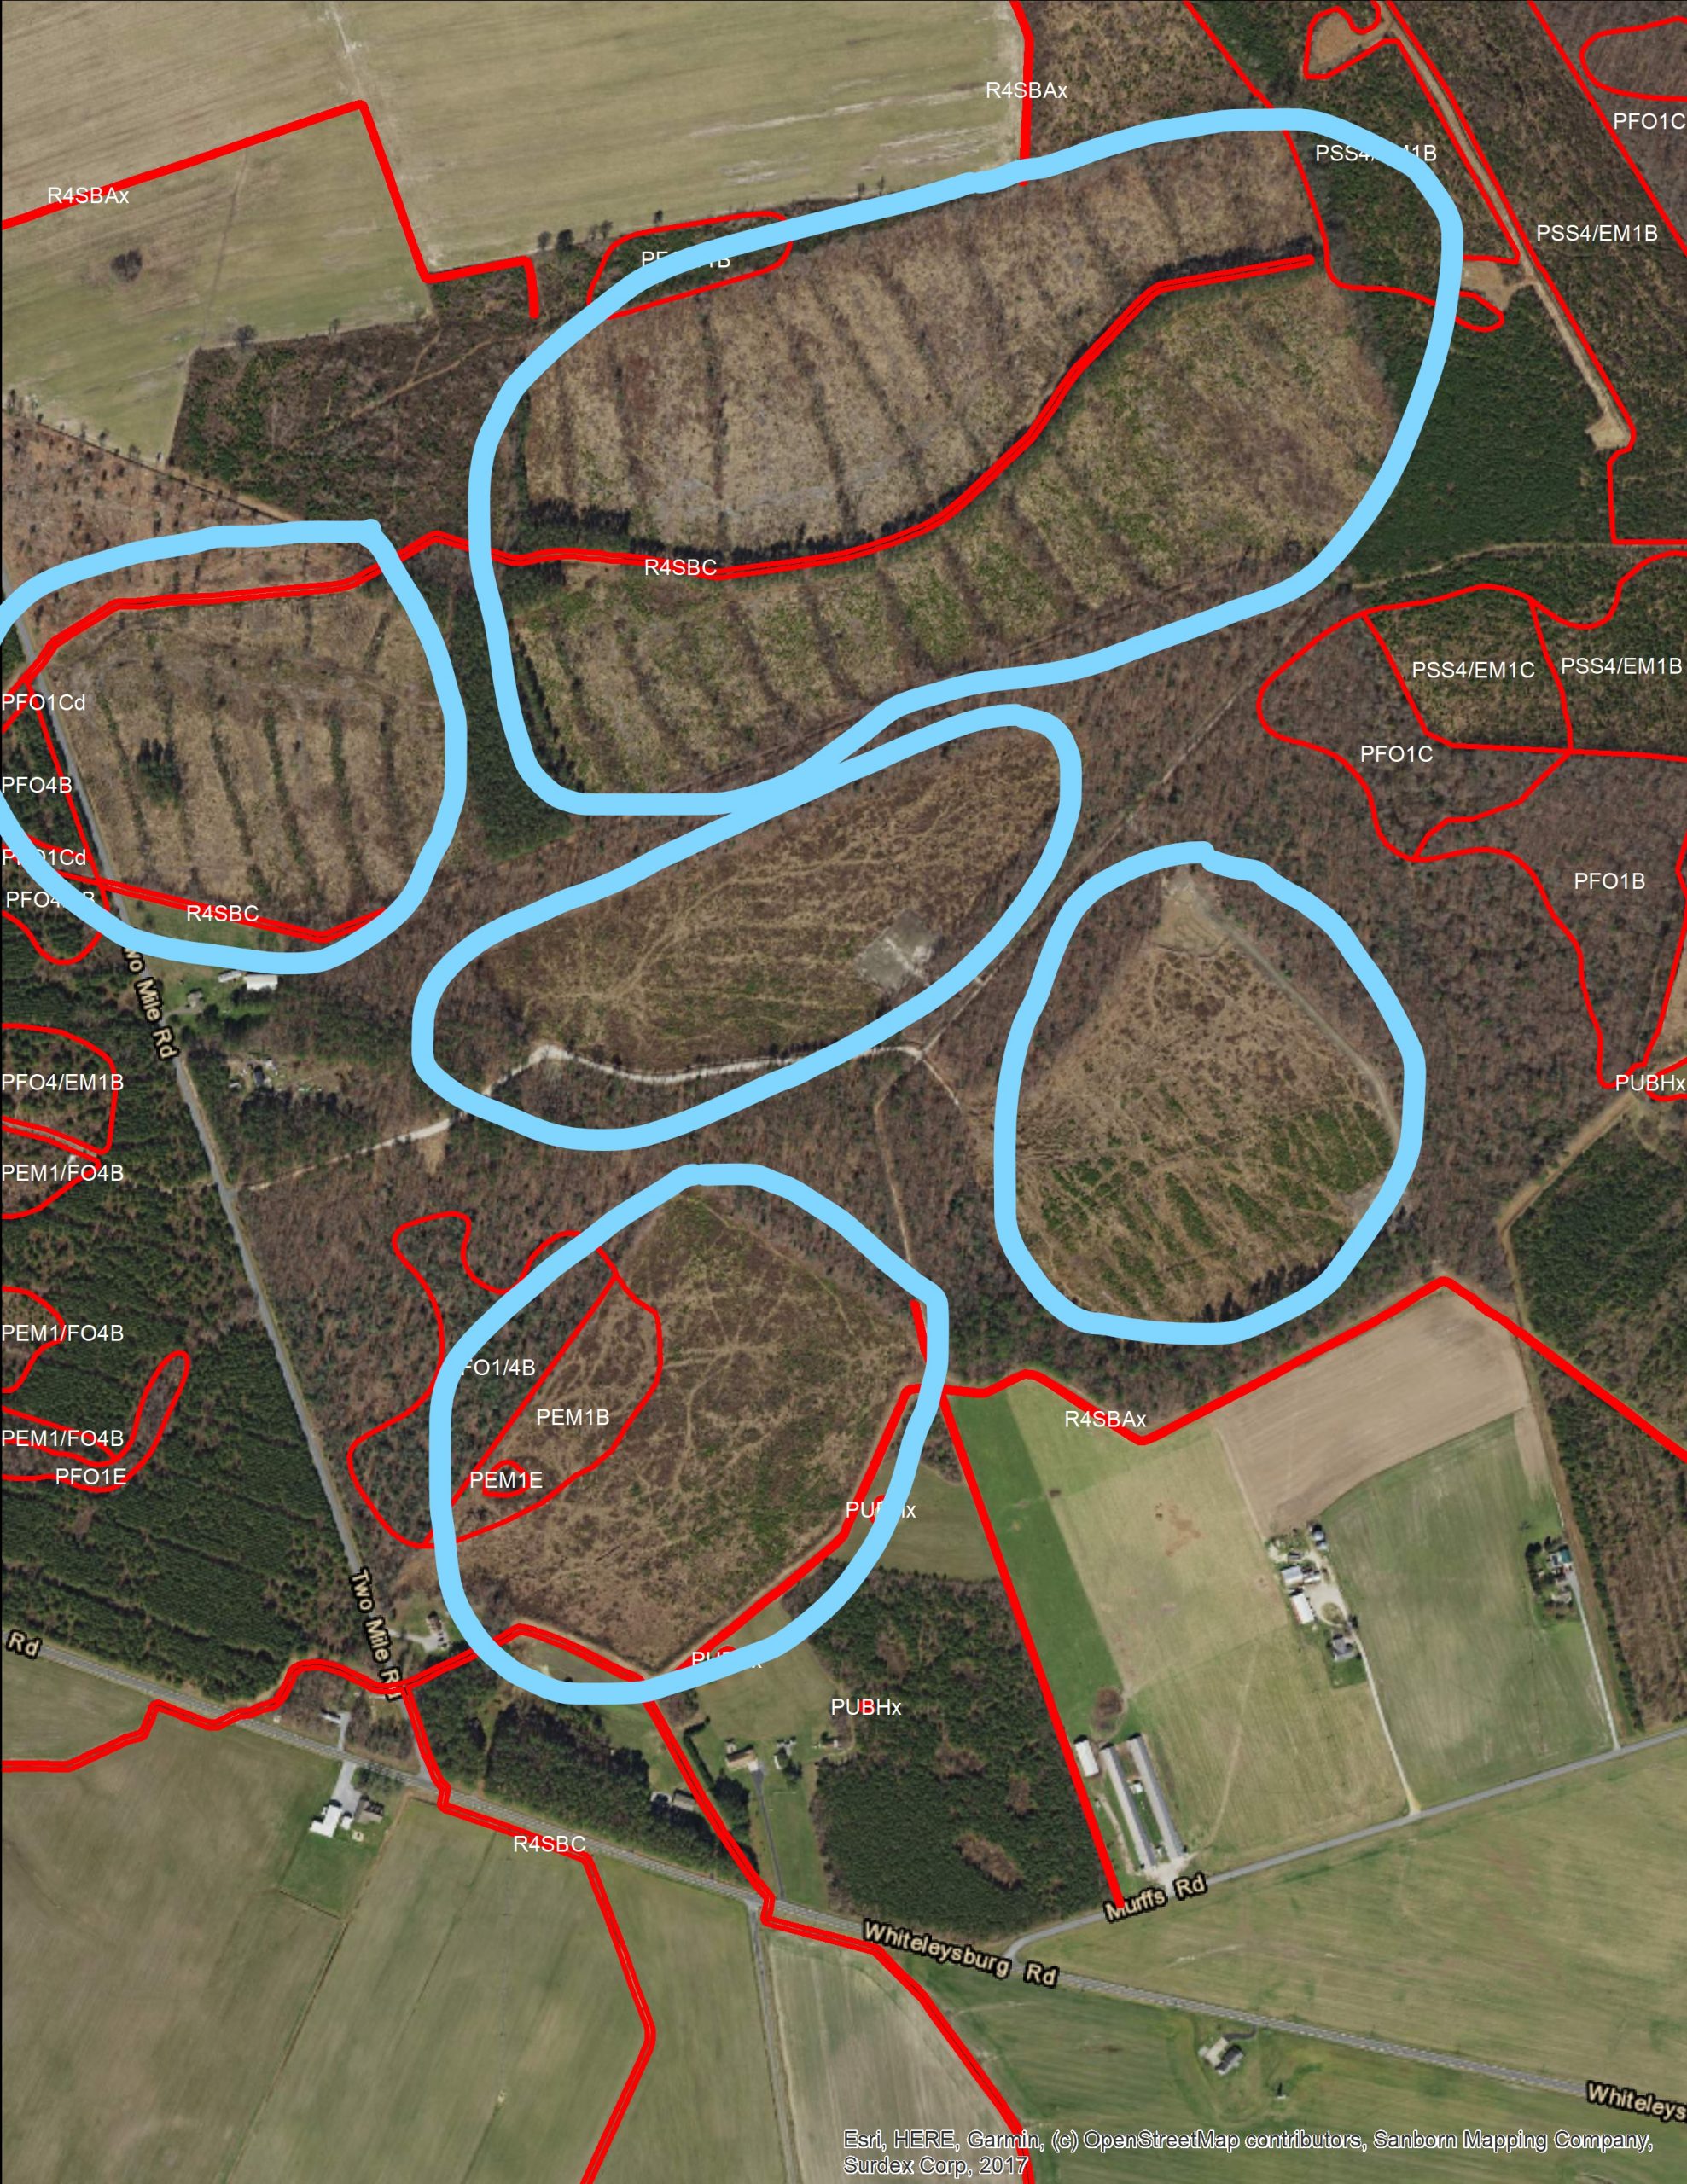
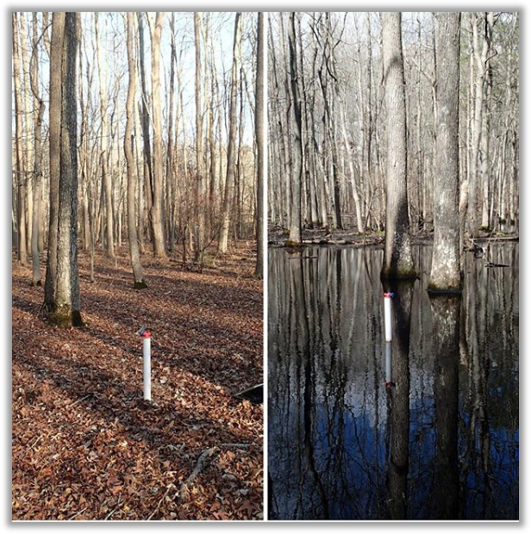
Who would want to live in or on a wetland, you ask? Not me! What right-minded homeowner would think that building a house or a business on a wetland is a good idea? Unfortunately, many missteps can lead to this situation. First, not all wetlands look like wetlands year round. Delaware’s most common wetland is forested but flat and holds water at or just below the surface even in the wet season, not flooded in pools and ponds. It’s not the obvious bog type wetland you may have envisioned. Because of this, they often go unmarked and, therefore, fall victim to conversion and loss. Also, by the time buyers see a house for sale, the ground has been so worked and pushed around that you would never suspect a wetland was underneath layers of fill dirt.
So did Delaware’s wetlands suffer a loss between 2007 and 2017 according to this statewide mapping project? Yes, and the figures indicated that the pace and source of losses have stayed consistent. Through an analysis of wetlands that were there in 2007 but were gone in 2017 to calculate the acreage, type (tidal or non-tidal) and sources of loss over the span of a decade. We classified sources into six categories: clearing, development, agriculture, transportation/utilities, environmental impacts and technique improvements. Technique improvements were a class of mapping changes related to the computer software and updates in technology, not changes on the landscape, and were therefore not included in loss calculations.
Our study showed that Delaware lost 3,011 acres of wetlands statewide between 2007 and 2017. Most of the wetlands destroyed or converted were non-tidal (92%), with losses to tidal wetlands making up the remaining portion (8%). Losses to non-tidal wetlands occurred mostly in forested, headwater wetlands
The sources of wetland losses over that decade vary greatly for non-tidal compared to tidal wetlands. Our coasts are being impacted by sea level rise and heavier, more frequent storms, so it’s no surprise that 66% of tidal wetland losses were due to environmental impacts such as erosion. Only 13% (31 acres) were deemed due to development and another 10% (23 acres) were lost to transportation and utility work. Land clearing, usually timber harvesting, may be a transition to development or may regrow, caused another 9% (22 acres) which leaves 2% (4 acres) lost due to conversion to agriculture (poultry, row crops, livestock).
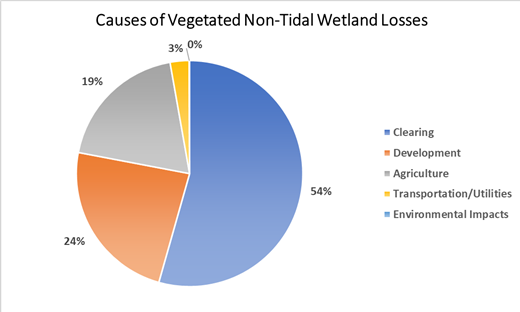
Compare that to non-tidal wetlands, where 54% (1,508) of losses were due to clearing, 24% (654 acres) to development, 19% (533 acres) to agriculture and only 3% (75 acres) to transportation and <1% (2 acres) to environmental impacts. A very different picture between wetland types which is important to recognize. It’s also important to point out that wetland loss rates and causes vary around the state. Sussex County is host to nearly half (48%) of Delaware’s wetlands but accounted for 66% of wetland losses between 2007 and 2017. Subsequently, 23% came from Kent County and 8% from New Castle County.
For those of you who think in terms of watersheds instead of counties, we can speak your language too. Statewide wetland losses from 2007-2017 occurred mostly in the Chesapeake Bay Basin (62.5%, 1,884 acres), followed much further back by the Delaware Bay Basin (18.7%, 565 acres) and Inland Bays (16.6%, 501.5 acres). The Piedmont Basin which does is not comprised of many wetlands, contributed 1.9% or 60 acres of wetland lost during this time.
Unfortunately, this study reported many continuing trends compared to a similar study for 1992-2007. The Chesapeake Bay Basin and Sussex County were the main sources of loss, with clearing (timber harvesting) again as the main source, followed by development and agriculture. Forested freshwater wetlands continue to suffer the most losses. It is not that surprising , though, given that wetland regulatory programs have not been strengthened in the last 10 years and the push for economic growth continues to take priority.
Based on these results we know we have our work cut out for us. We need to do more to raise awareness for wetland values and protection against destruction. Looking ahead to 2027, we would like to see a decline in wetland losses, an evening out of trends among counties and basins and a decrease in forested wetland habitat loss.

Written on: December 8th, 2021 in Wetland Restoration
By Sarah Bouboulis, Partnership for the Delaware Estuary
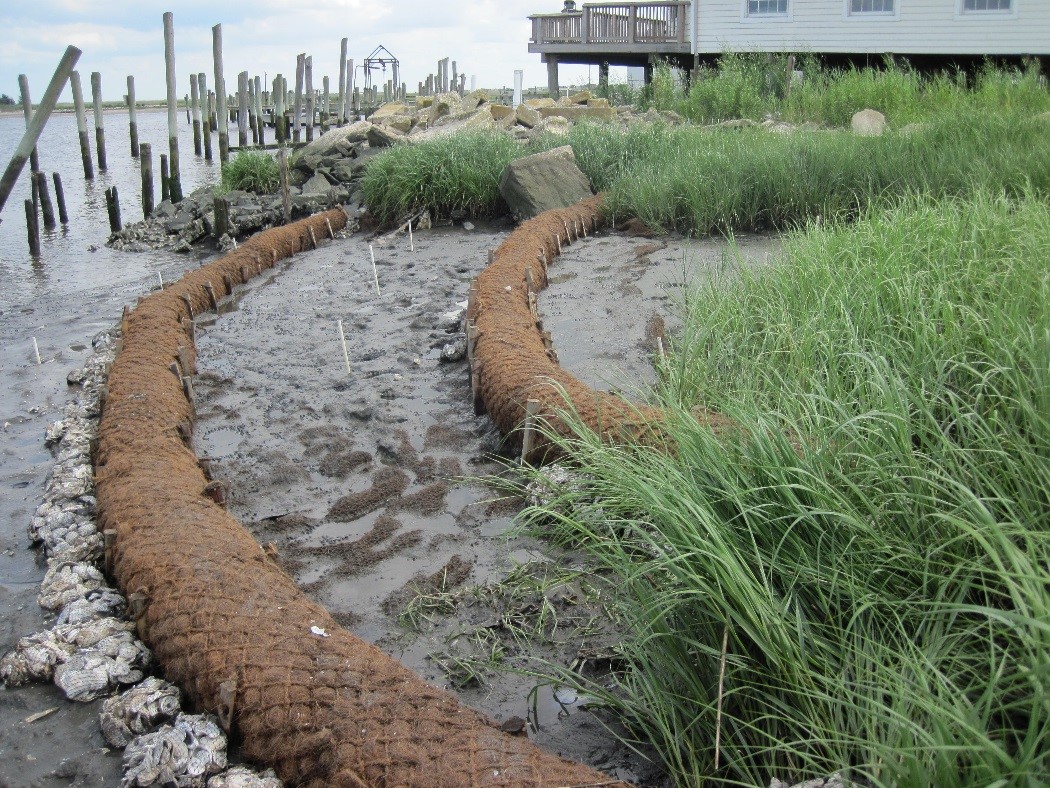
The Partnership for the Delaware Estuary (PDE) has been interested in living shorelines and shellfish research since the early 2000’s, led by Senior Science Director, Dr. Danielle Kreeger. Since 2004 PDE has installed several living shorelines throughout the Delaware Estuary, primarily using materials such as coconut coir logs, Oyster Castles© and oyster shell bags. During the formative years of PDE’s Delaware Living Shoreline Initiative program (DELSI) and subsequent project monitoring, it became clear that oyster shell bags, in many instances, were one of the best choices for living shorelines based on shellfish recruitment and shoreline stabilization data. However, recycled oyster shell were becoming a hot commodity (i.e. expensive and hard to come by). Subsequently, PDE saw a need for an oyster shell recycling program within the Delaware Estuary.
It took quite a few years to have resources lined up in such a way that both space and funding, for management of the shell, were secure. The stars finally aligned in 2016 when space and funding became available simultaneously in Wilmington, Delaware.
Pre-pandemic, the program was collecting from 9 restaurants in Northern Delaware and one in Dover, Delaware. Between 2016 and 2019, the restaurant collections averaged 1,400 bushels a year (or 70,000lbs). Sadly during 2020 most restaurants closed for an extended period of time and, unfortunately, a few restaurants were forced to close permanently. Since businesses have begun to open back-up, collections have re-started and for 2021 the total collections will near 1,000 bushels.
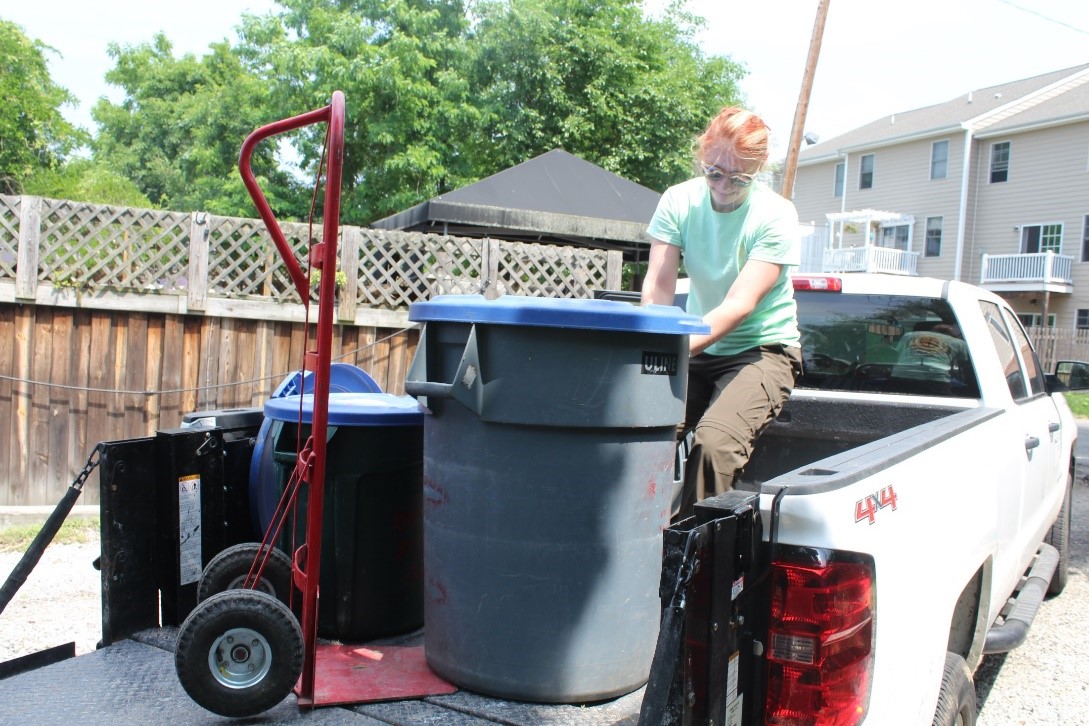

Currently, collections are only with restaurant partners. Pick-ups are conducted weekly or bi-weekly, depending on the season, and the shell is brought back to the shell management area in Wilmington. Shell is cured in the open between 6-12 months, being turned at least once during that time before it is then, usually, bagged and ready for use on living shoreline or other restoration projects. The curing time is set to make sure the shell has properly cured and there is no risk of introducing disease, pathogens, or other foreign materials back into area waters.
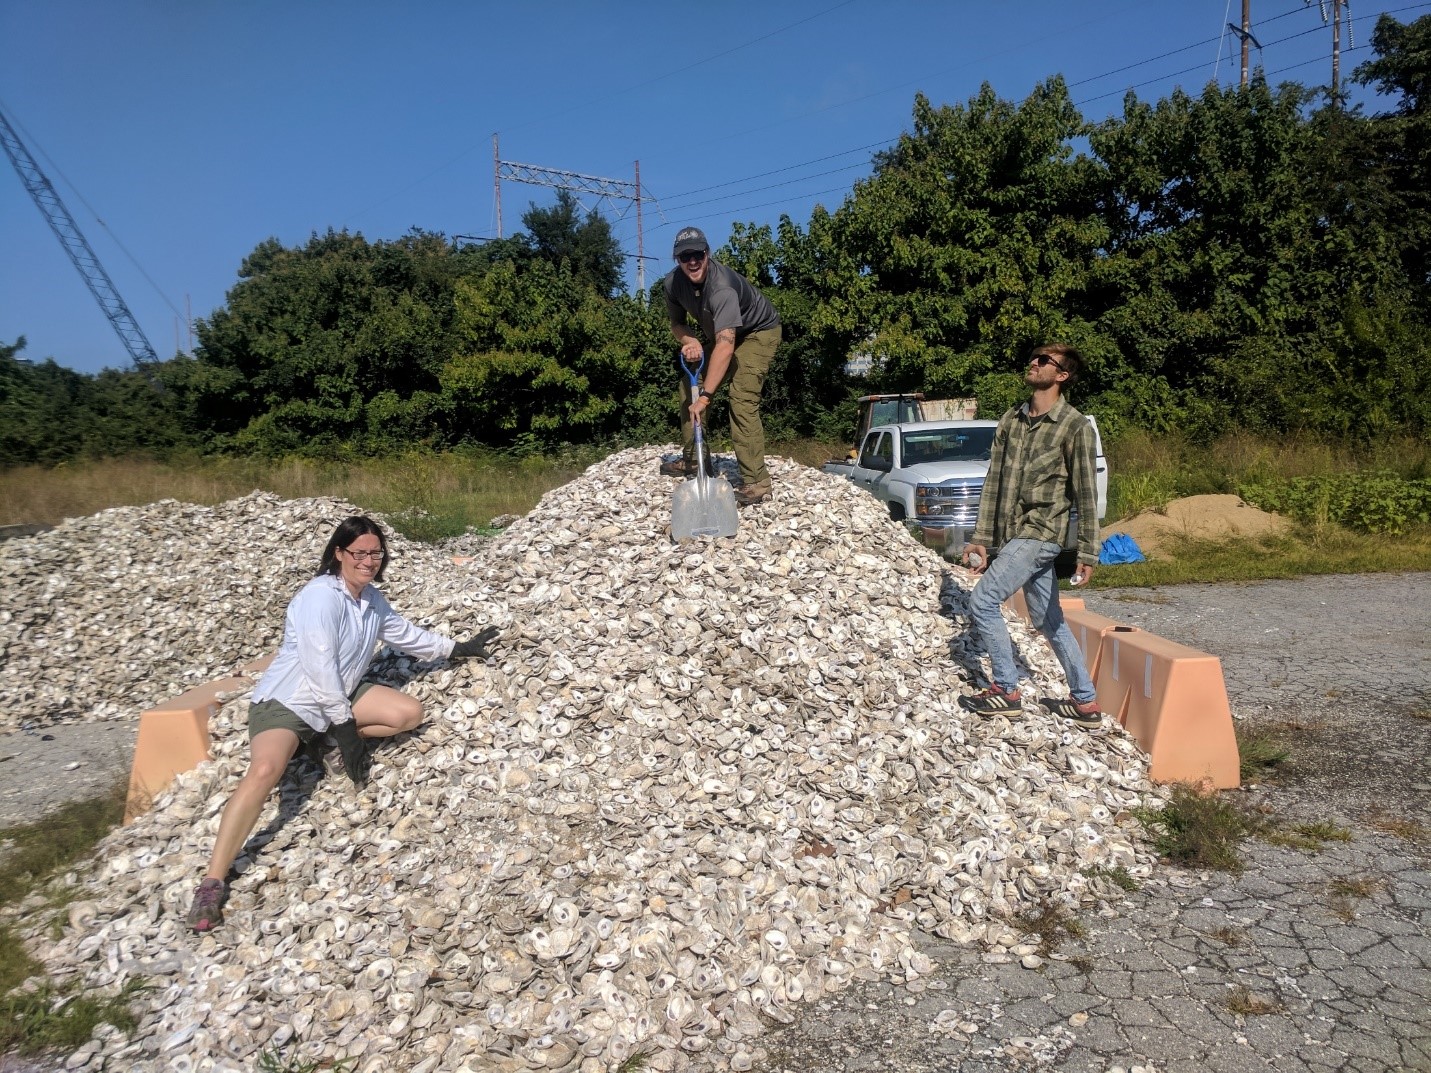
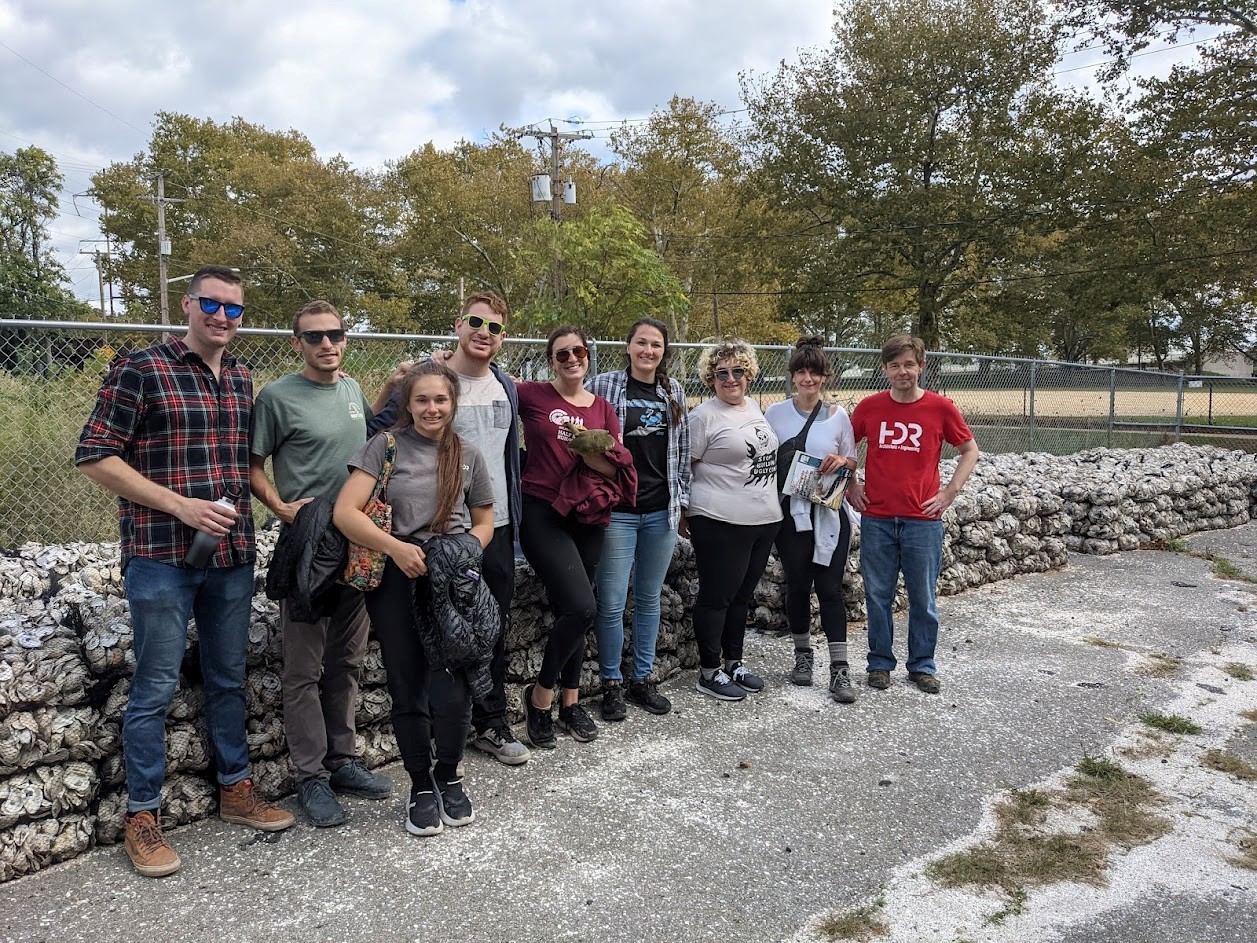
The next step is preparing the shells for transport and/or use on a living shoreline. This typically involves putting the shells into mesh bags. This is the most time and labor intensive portion of the process and it would not get done without the help of countless volunteers. It is also a group activity, needing around 10 volunteers per bagging session. Groups from University of Delaware, Delaware Technical Community College, Wilmington Green Jobs, Bank of America, the Camden Power Corps and many others have all helped with shell bagging. And PDE is so appreciative of their participation!

The fully cured shell goes primarily to living shorelines projects, many put in by PDE. Recycled shell is also sold to restoration partners for other projects such as reef creation and aquaculture research, as well as living shorelines being implemented by others. The main focus of PDE’s oyster shell recycling has always been to support projects within the Delaware Estuary, however, when excess shell exists it has been sold outside the Estuary. You can view a new story map outlining all of PDE’s living shoreline projects, most of which incorporate recycled oyster shell here.
Since inception, over 12,800 bags of shell have been created, which could secure over 4000 feet of shoreline! The shell has gone to support projects in all three states in the Estuary involving a tremendous amount of partners including the Philadelphia Water Department, DNREC, USFWS, The Nature Conservancy, Haskin Shellfish Research Laboratory, and University of Delaware, to name just a few!
In 2022, PDE hopes to expand oyster shell recycling into the city of Philadelphia along with help and support from the Philadelphia Water Department. In such a major metropolitan area, and with a much larger shell management area, the program should be able to collect and cure several times more oyster shell than our current operations.
To learn more about the program, how to volunteer or to purchase shell, you can view our website here or contact Sarah Bouboulis; sbouboulis@delawareestuary.org.
Written on: December 8th, 2021 in Wetland Assessments
By Brittney Flaten, DNREC’s Watershed Management and Assessment Section
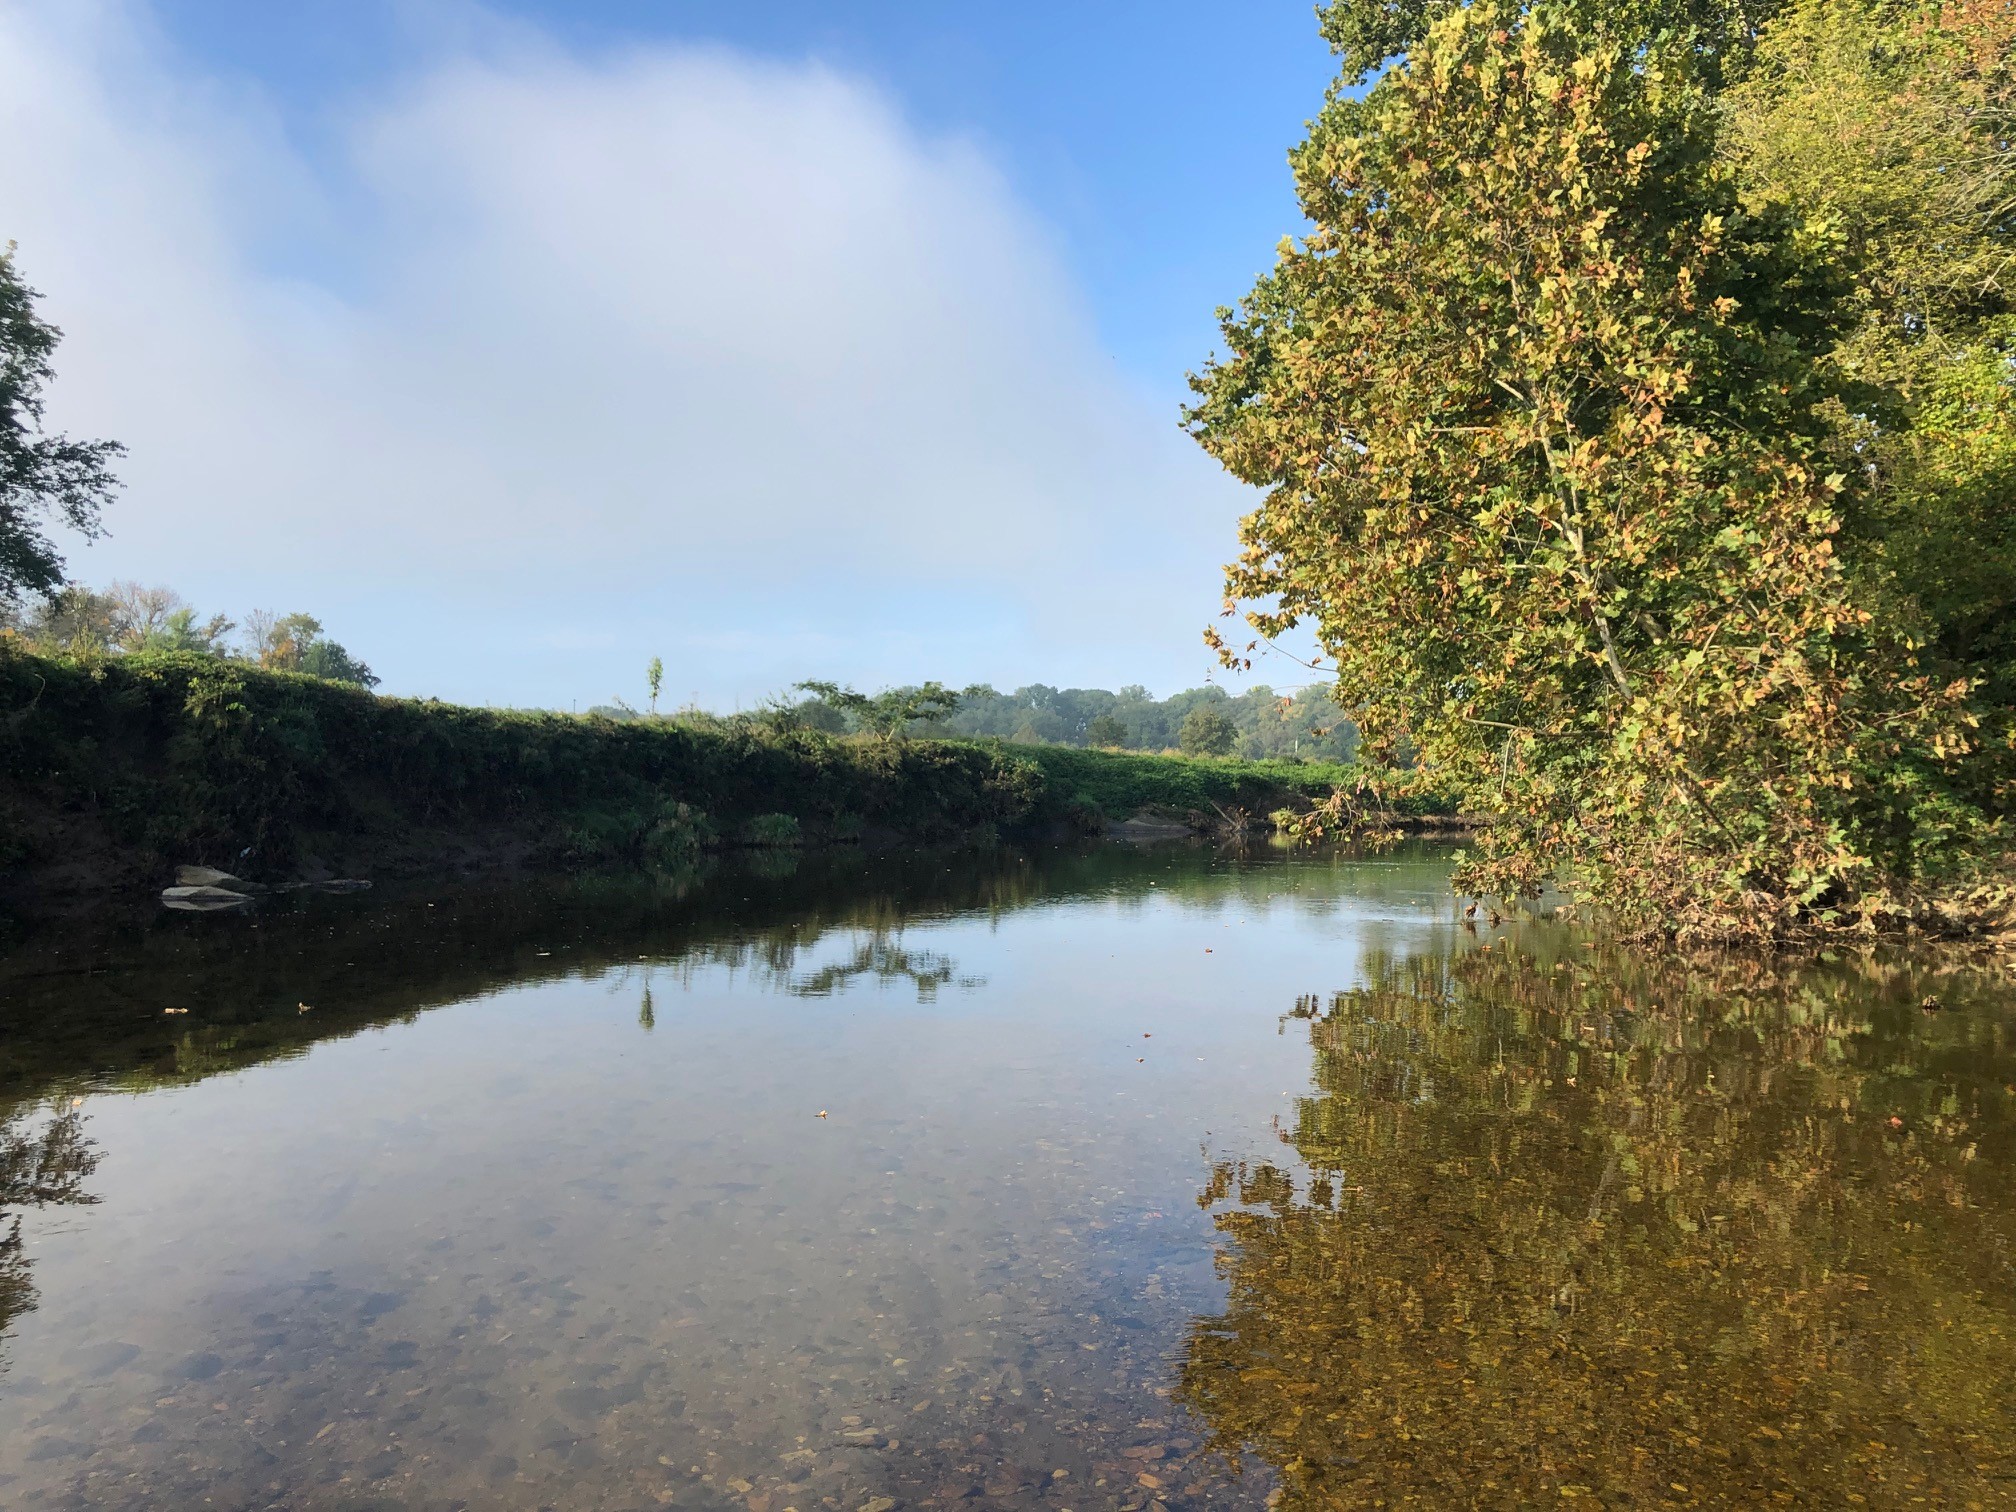
Before I started at DNREC, I worked in Maryland conducting stream health assessments. When I joined the Wetland Monitoring and Assessment Program (WMAP) I was excited to learn that the team was working on a new stream assessment protocol. Let’s look at what a stream assessment is, and how stream health relates to the work that our team does in Delaware.
What is a stream assessment?
Stream assessments can be used by governments, nonprofits, or citizen scientists to document stream health in their area. Most states have their own protocol – WMAP is currently working on one for Delaware! Local environmental groups like Nanticoke Watershed Alliance and Delaware Nature Society have their own methods that volunteers use to collect data. While each organization may have a different protocol for assessing stream health, there are generally four kinds of data collected.
Water Quality
When WMAP is assessing stream health, we’re interested in measuring characteristics like water temperature, dissolved oxygen, and pH, which impact what kinds of animals can live there. In the field, we use a handheld water quality meter with sensors that can detect temperature, oxygen, and dissolved ions in the water. We also look for signs of water pollution like discoloration, oily sheens, excessive algae, or unusual smells. There are several organizations in Delaware that collect other kinds of water quality information like the concentration of nitrogen, phosphorus, and total suspended solids. If you’re interested in learning more, you can check out the Delaware Water Quality Portal.
Hydrology
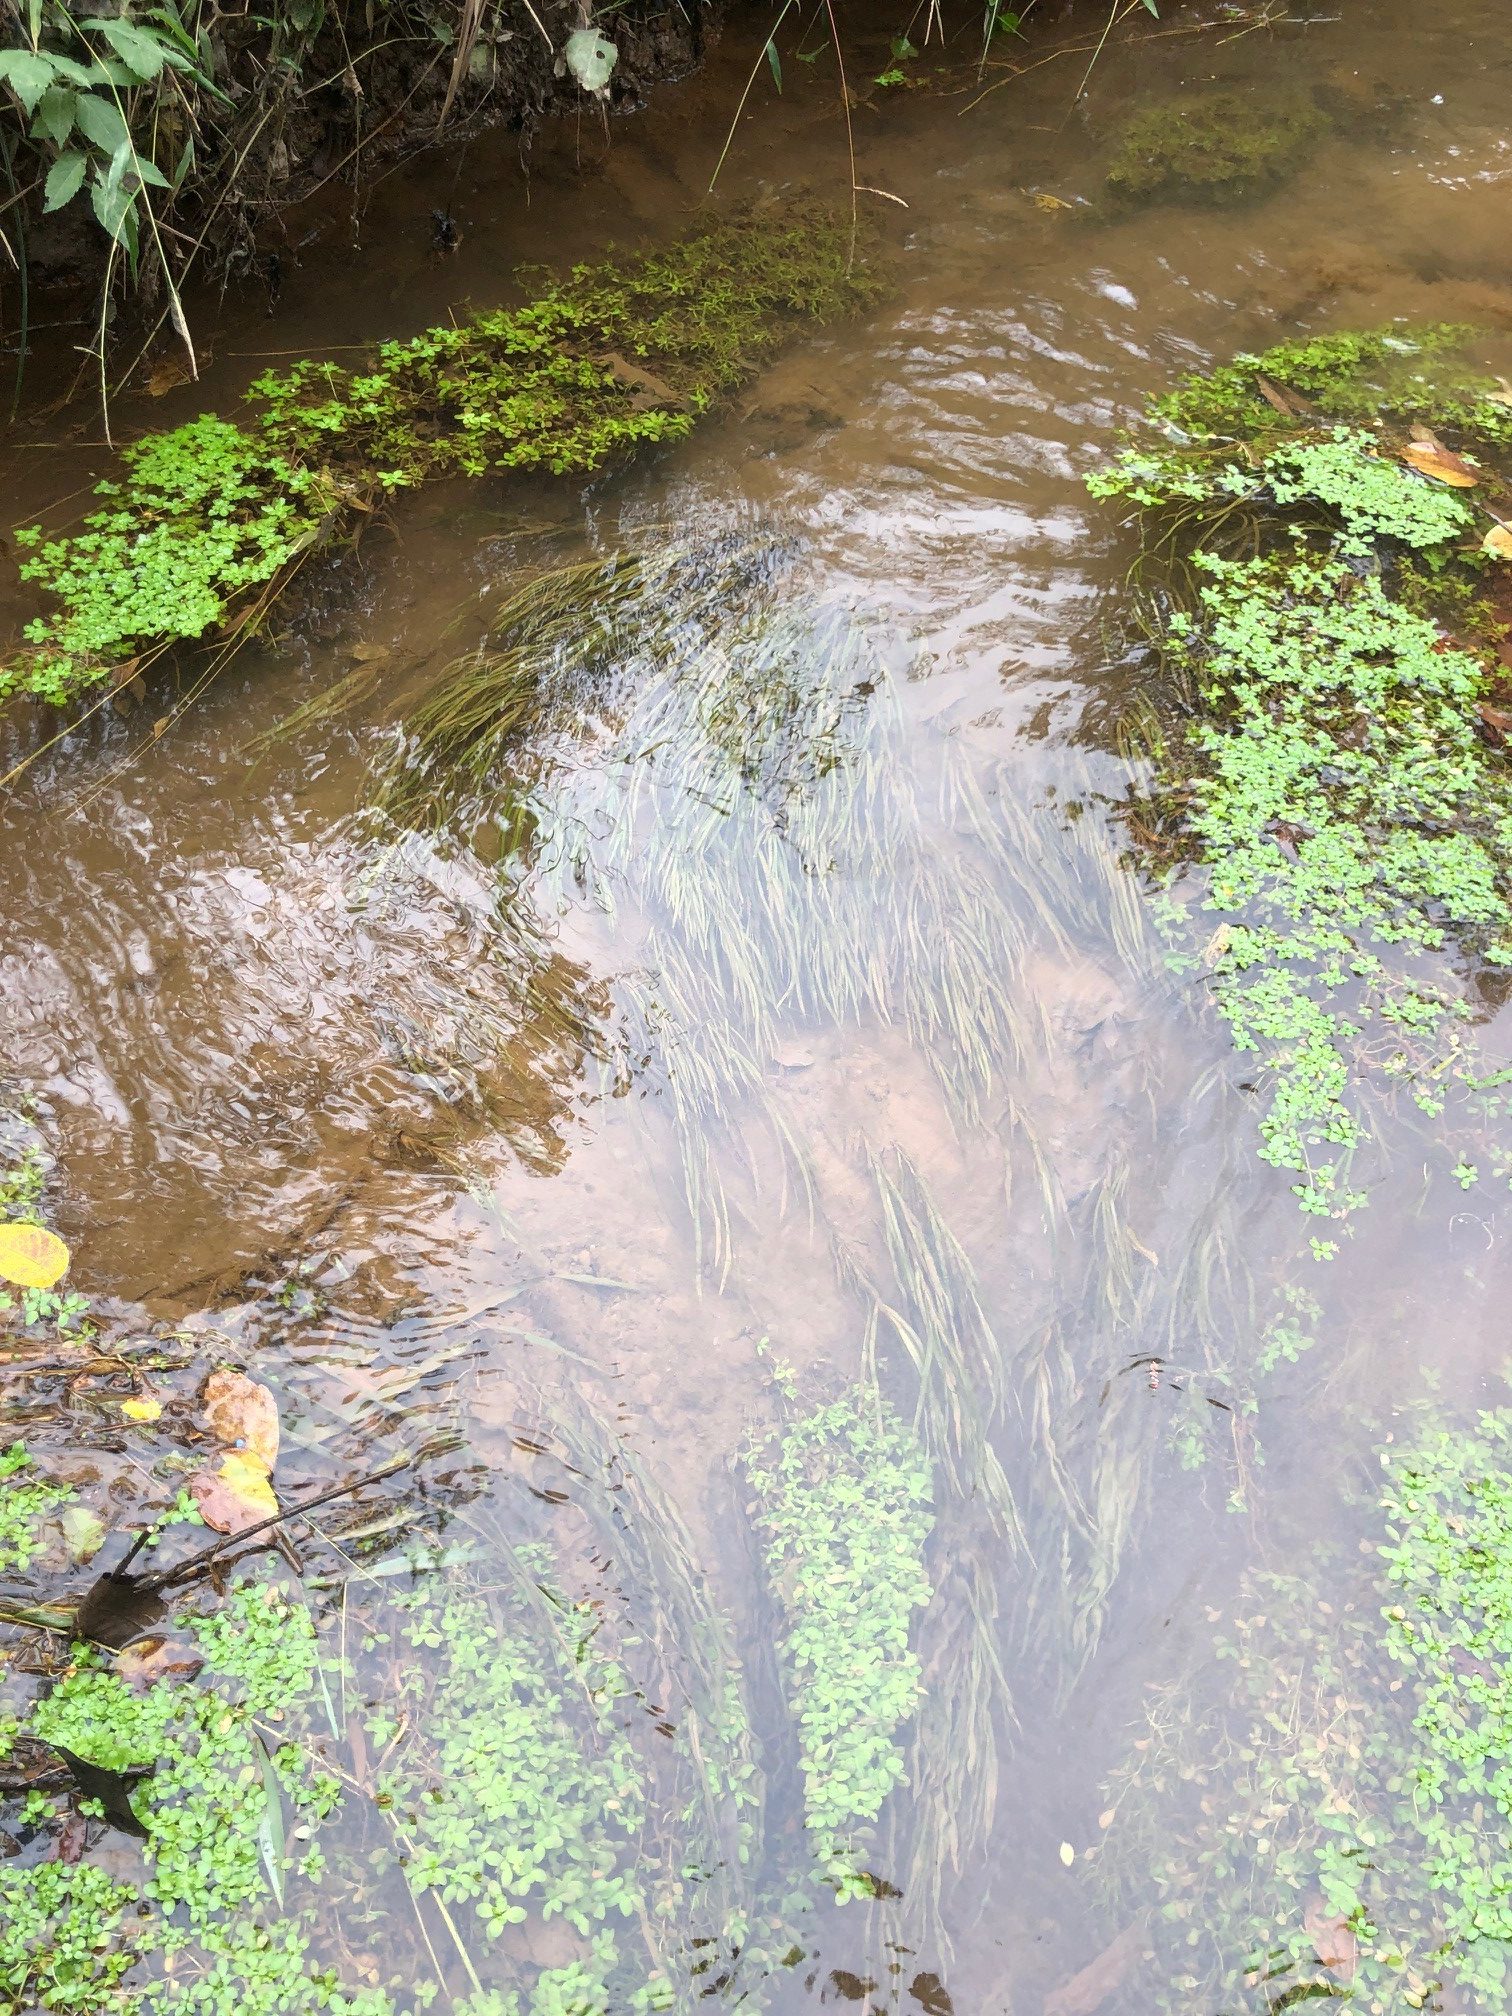
To assess hydrology, we look for evidence that the stream’s shape has been altered by humans. Some examples of alterations include culverts, dams, or walls that straighten the stream. We’re also interested in the stream’s ability to connect with the surrounding floodplain, which we can determine by looking at how incised the stream is. Floodplain connection is particularly important during storm events. When water levels rise, the excess water and debris can spill out onto the floodplain, rather than causing damage to inhabited areas or infrastructure downstream.
Habitat
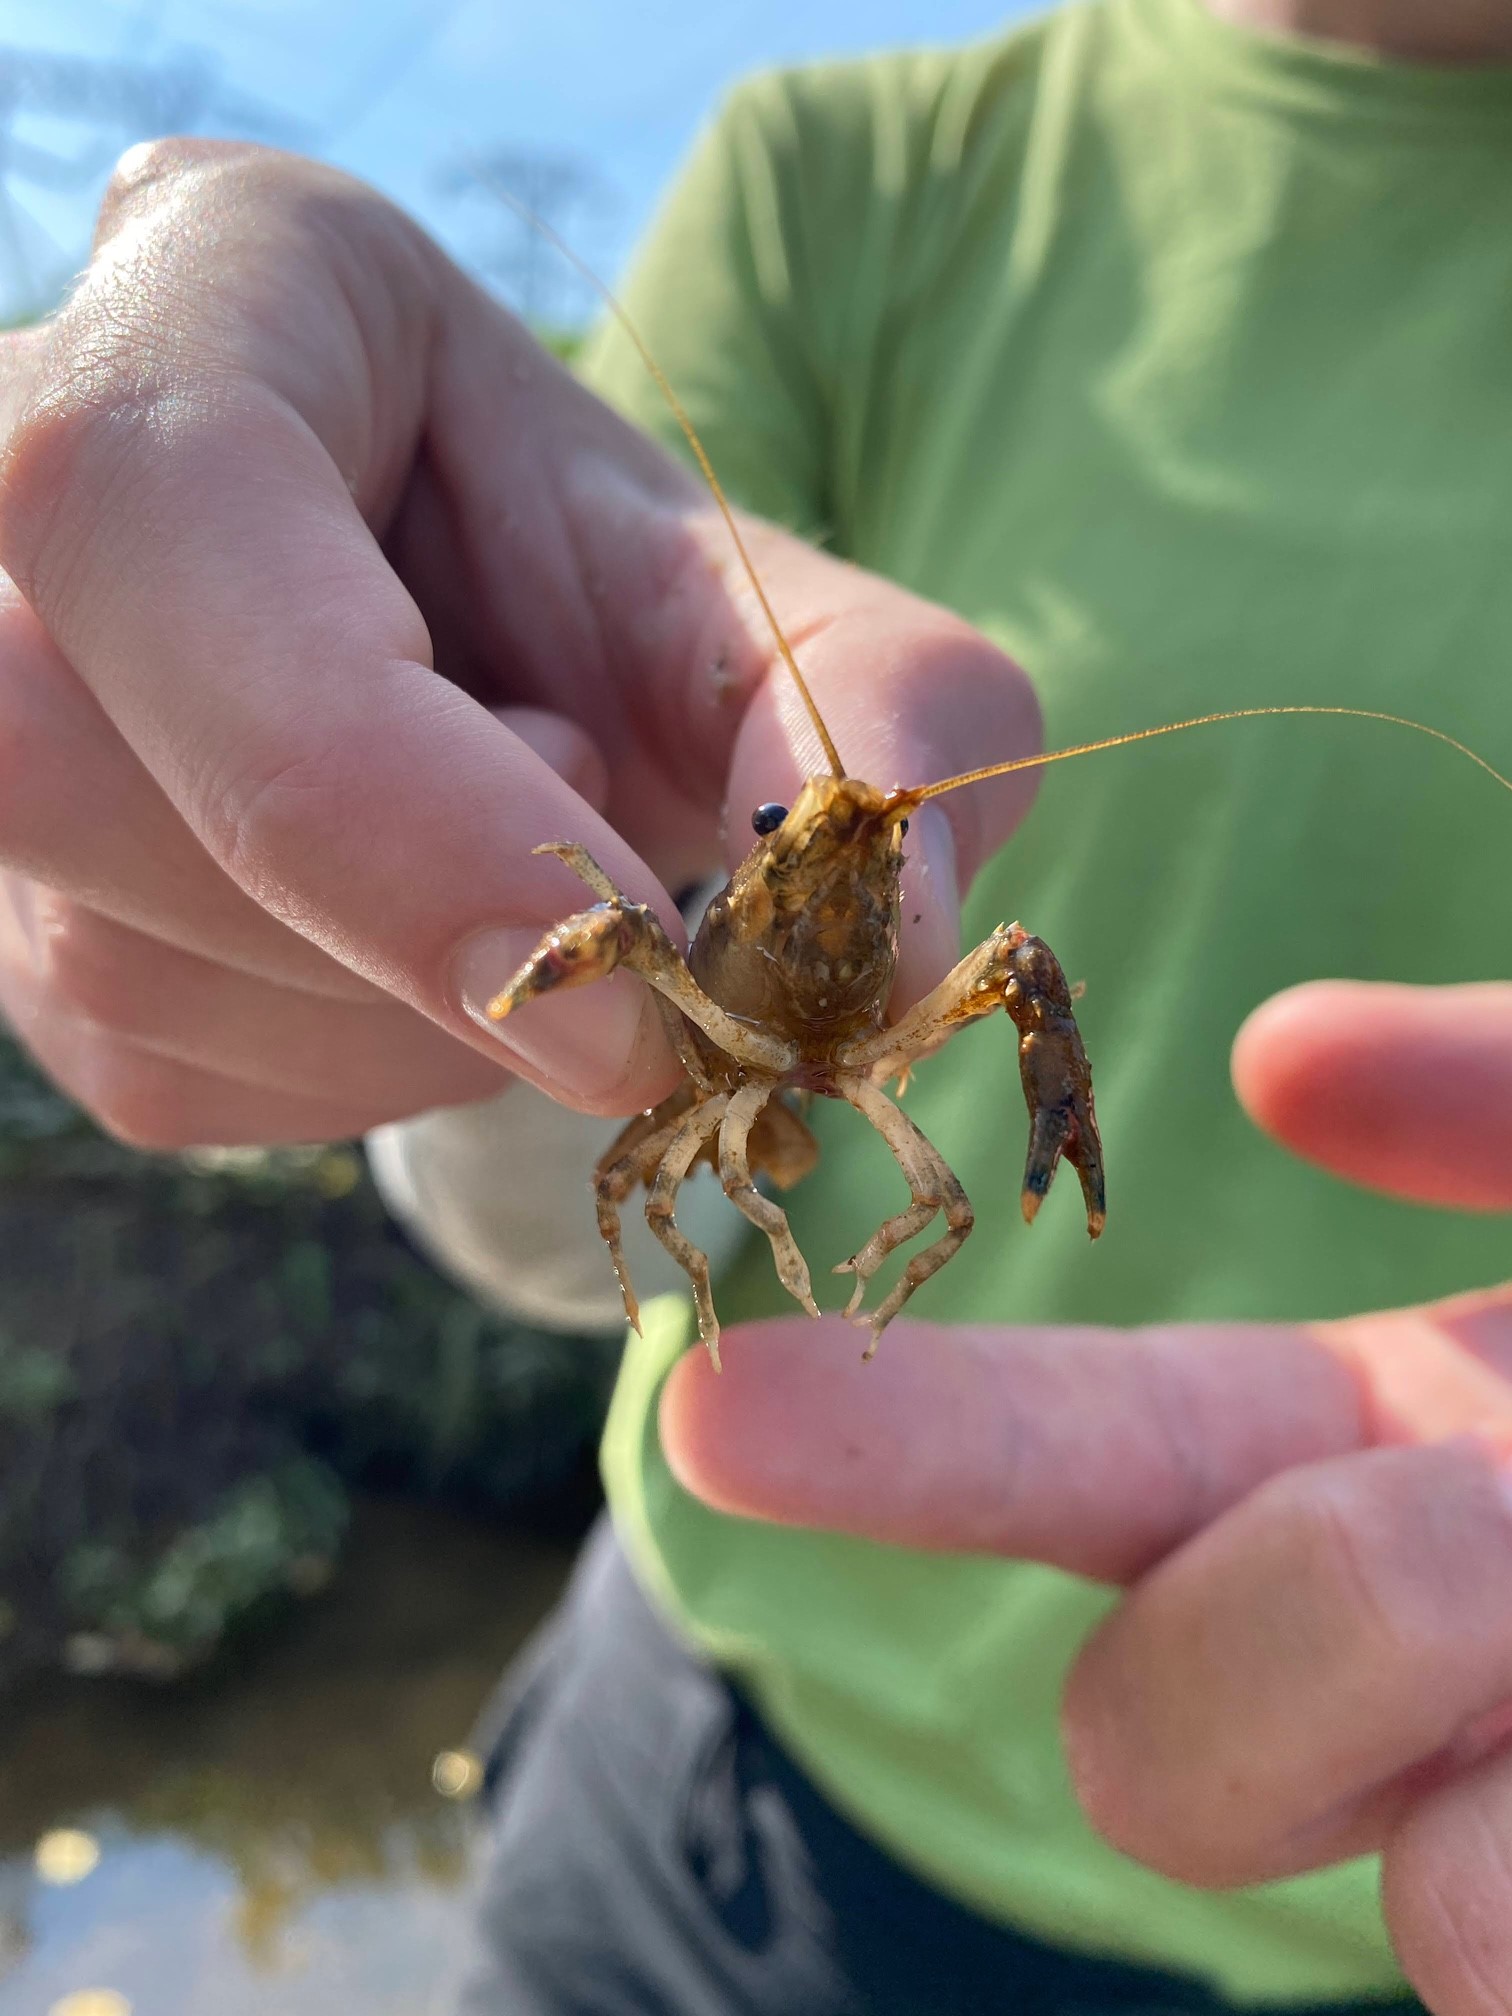
Before looking for organisms, we assess the quality of habitat in the stream. Potential habitats include submerged aquatic vegetation (SAV), logs and other woody debris, piles of leaves, and root wads from trees. All of these provide a place for organisms like fish, crayfish, and insects to hide from predators and find food. We also look for signs of excess sedimentation in the stream, which can stress fish, invertebrates, and aquatic vegetation. Tall, eroded banks, muddy water, and lots of silt or clay covering the bottom of the stream are all signs that there is too much sediment.
Biology
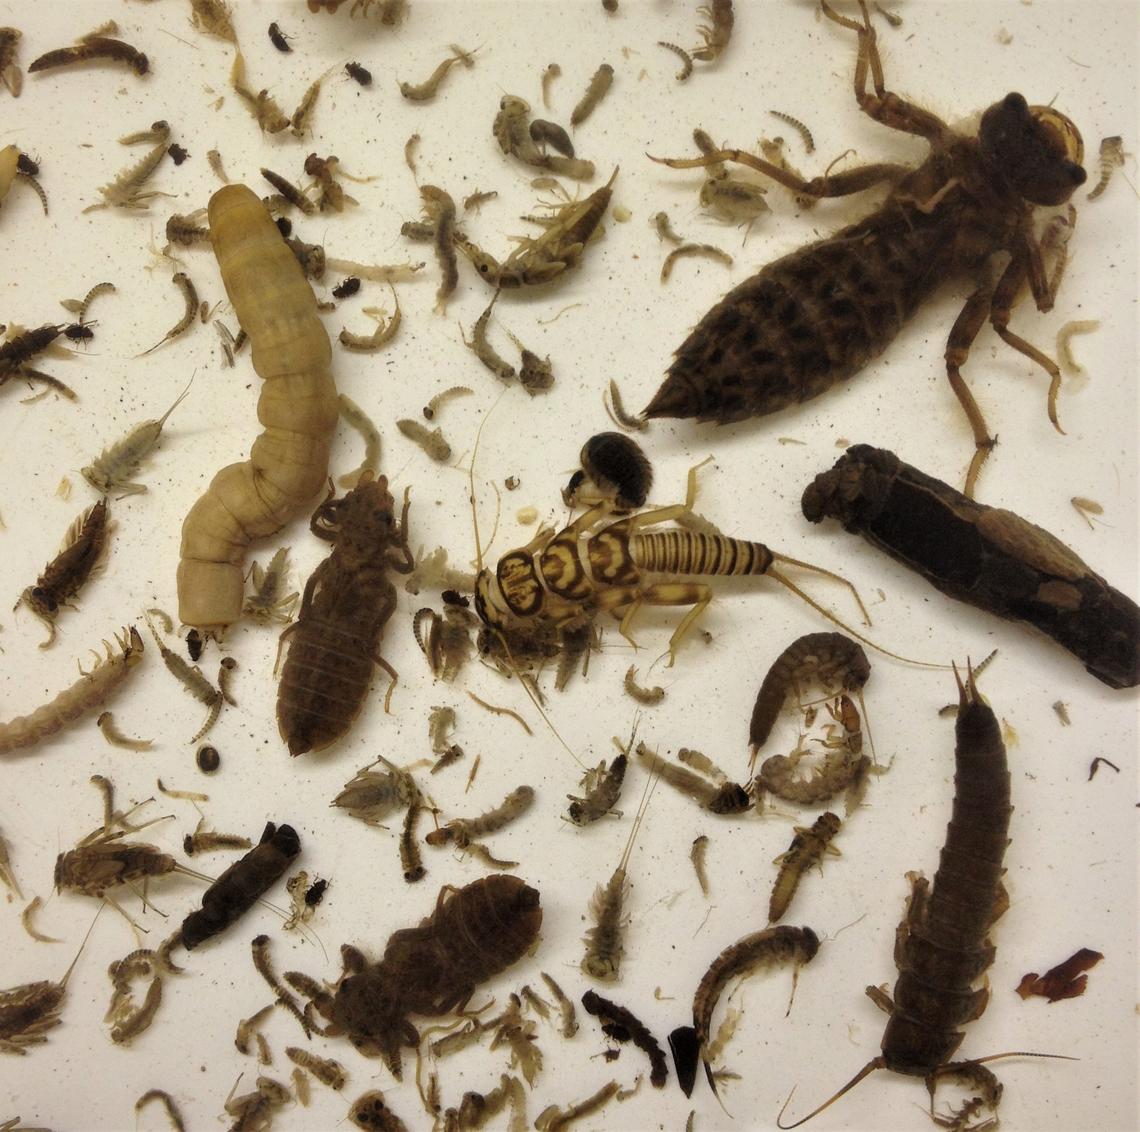
To find living organisms in streams, we sample habitat like logs and root wads using a D-net, which has very small holes that only let water escape. Most of the organisms we find in our nets are benthic macroinvertebrates like freshwater clams and mussels, snails, mayflies, water beetles, and dragonfly larvae. We use keys and guidebooks to help us identify, sort, and count them in the field. Of course, we also look for fish, salamanders, and frogs! Sometimes we’re lucky and find one in our D-net, or we see them but can’t catch them! In the office, we categorize organisms based on how tolerant they are to environmental stressors like pollution or low dissolved oxygen levels. For example, mayflies, stoneflies, and caddisflies are very sensitive to stressors, but worms and fly larvae are not. If we find many sensitive organisms in our sample, it’s likely the stream is in good condition.
Why are we interested in stream health?
Clean streams provide clean drinking water, good habitat for fish and other organisms, and opportunities for recreation. Also, stream health and wetland health are closely related. Riverine wetlands, for example, depend on water supply from streams that are well-connected to the floodplain. On the other hand, wetlands purify water before it enters streams and rivers by trapping substances like sediments, fertilizers, and pesticides. Both wetlands and streams are important in improving the overall health of our watersheds. If you’re interested in learning more, visit the Division of Watershed Stewardship’s website. If you’re looking to get involved in stream health in your community, there are several opportunities with Nanticoke Watershed Alliance, Delaware Nature Society, and University of Delaware Citizen Monitoring Program.

Written on: December 8th, 2021 in Education and Outreach
By Olivia McDonald, DNREC’s Wetland Monitoring and Assessment Program
Get ready to get down and dirty as we wade into Delaware’s wetland habitats for an interview.

No better way to get to know wetlands than by chatting with one. Today we’re interviewing Delaware’s wetlands. Thanks for taking the time to join us today for a chat!
Of course, I love any opportunity to get the word out there about who I am.
Let’s start in the past. Could you tell us a little about your history? Like how you got to where you are today?
Well, the best way to put it is that it all started a very long time ago. Although some wetlands can form very quickly, many actually take thousands of years to develop. In the case of myself, as tidal and non-tidal habitat, it has been most common through the years for me to form when coastal lowlands flood, when rivers deposit sediment as they reach the ocean, through periodic flooding or high water tables, in isolated or low-lying areas surrounded by dry land, or through other forces of nature – including people! Over time, herbaceous plants, shrubs, and trees with special adaptations take root in my soil. Since about the 1600’s, at the start of colonial settlement in Delaware, I’ve been facing challenges ranging from land loss from development, to the effects of climate change, and that’s just in the past 30 years. Currently, I make up 20% of the land in Delaware, and around 5% of the land in the United States.
What is a day in the life like for a wetland?
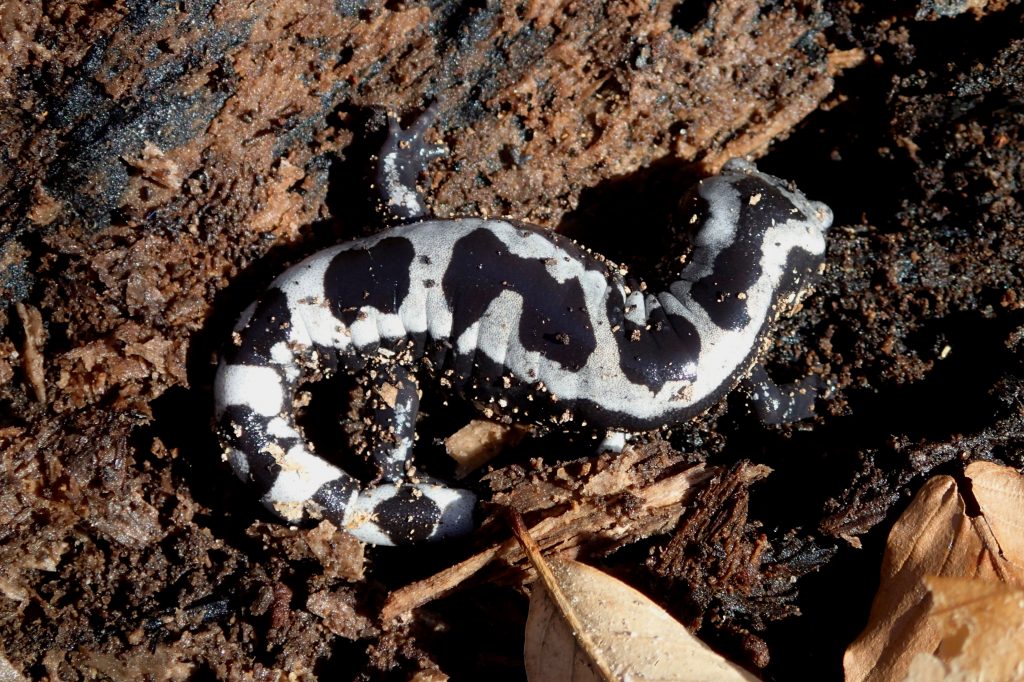
Busier than you think! I actually have a lot of responsibilities for others, not just myself. Many species of birds and fish depend on my specialized habitats. Some of Delaware’s most unique species, like the Marbled salamander, call me their home. I also do tons of cleaning, and not like the tidying up kind. I filter toxins and pollutants out of the water through my spongy soil, and absorb carbon dioxide or other greenhouse gases. This helps with making sure that any water entering our streams, rivers, and groundwater systems is clean. I also divert floodwaters to keep them away from people and their property. And let’s face it, Delaware is not very high up off the ground. So negative impacts from large storm events, such as flooding or erosion, would occur more likely if I simply was not around. The easiest way to put it is that my job is to provide, purify, and protect. That’s what I spend my day doing and love it.
What is one strength and one weakness?
A strength? Hmmmm. I’m really good at giving people what they want. And I mean that in an economical and even emotional sense. Here in Delaware, the outdoor enthusiast lifestyle is growing rapidly. Eco-tourism is a major component to the state’s economy, as well as the development industry. State parks, recreational activities, nature centers, they all rely on wetlands in some way. As for the emotional bit, it can be simply put; people rely on wetland ecosystems to make them happy. Whether it is kayaking at Killens Pond State Park, or fishing at the beach, people far and wide are getting outside to experience the great outdoors. And wetlands are gateway to that personal joy.
On the other hand, my weakness has more to do with perception. I’d say the hardest thing I deal with is being misidentified. I’m usually covered with water during the winter and spring months, then my surface is often dry during the summer and fall months. My tidal wetlands, or better known as marshes, tend to get the spotlight. Sometimes that shadow casts over my non-tidal, or freshwater wetlands, that come in all different shapes and sizes. I’ve got flats, depressions, riverine, swamps, and fens. My changing water levels and specialized habitat types can make identifying me as a wetland area very difficult, and that’s tough to deal with.
What is your biggest challenge you face right now?
Policy and implementation. Take my non-tidal wetlands for example. Currently in Delaware, the state only regulates non-tidal wetlands of 400 contiguous acres or more. And my freshwater habitats make up 75% of all the wetlands in Delaware! That’s a large amount of uncertainty when it comes to my protection. When you think about implementation, that’s more along the lines of what can be done to protect me on any size scale. If you can believe it, 80% of my wetlands are actually on private property, which leaves another huge amount of planning to the average citizen. The challenge I’m seeing here isn’t that the public does not care, it’s that they simply don’t know! They’re not sure about incentive programs, people don’t have the scientific background in implementing restoration projects. But that doesn’t mean they can’t. For now, it’s an uphill battle, but one I’m certainly willing to walk.
So what can we do as the general public or homeowners to protect you for future generations to come?
First and foremost, educate yourself. The first step in understanding what to do in the future is how to behave in the present. Leave plants or an un-mowed strip of land between developed areas. Plant native species in your yard and remove the invasive ones. Dispose of trash in proper locations or recycle where appropriate. These baby steps on an individual level can assist me with my job to provide, purify, and protect. If you want to get even more involved in protection, start looking around at what is on your property. I mentioned earlier a challenge I constantly face is being misidentified. There is an amazing mapping resource, The Freshwater Wetland Toolbox, that can assist you with finding wetlands or your property or in your local community. If you find out there’s a wetland on your property, you can use the Guidebook for Public Participation to learn about what you can do to manage my vital land. The information is out there and progress is moving forward for wetlands benefits, you just have to find it.
Well, we certainly learned quite a bit without putting on waterproof boots or hopping in a boat. Thanks again for taking the time to chat with us!
No problem at all. If you’d like to stay up-to-date on how I am doing, my biggest supporters at DNREC’s Wetland Monitoring and Assessment Program are always doing work in my favor. I can’t thank them enough for always building me up when I’m sinking down! I’m sure you’ll see more from me in the near future.

Delaware's Governor
State Agencies
Elected Officials
General Assembly
Delaware Courts
State Employees
Cities & Towns
Delaware State Code
State Regulations
Business First Steps
Phone Directory
Locations Directory
Public Meetings
Voting & Elections
Transparency
Delaware Marketplace
Tax Center
Personal Income Tax
Privacy Policy
Weather & Travel
Contact Us
Corporations
Franchise Tax
Gross Receipts Tax
Withholding Tax
Delaware Topics
Help Center
Mobile Apps
E-mail / Text Alerts
Social Media

Built by the Government Information Center
©MMXVIII Delaware.gov

