Facebook Twitter Instagram YouTube

Written on: December 14th, 2021 in Wetland Assessments
By Alison Rogerson, DNREC’s Wetland Monitoring and Assessment Program
In this fourth installment reviewing the results of DNREC’s ten year wetland mapping update and Status and Trends analysis, we’re digging up the dirt on wetland losses. This is likely the wetland topic with the most sensitivity. People who value wetlands are upset that they are being lost. People being accused of causing wetland losses are defensive. People who had a bad experience with wetland regulations that prevent losses feel frustrated. We’re not forensic scientists but we have the best available mapping technology on our side.
First off, how does one ‘lose’ a wetland? Where does it go? Lost is an interesting term and ‘converted’ or ‘destroyed’ may be more accurate. Wetlands exist when they have porous, spongy soils and have a connection to some source of water (rain, groundwater, overbank flooding etc.). A functioning wetland can be effectively destroyed if it becomes disconnected from its water source by a berm or a flood gate or dried out by ditching and channelizing streams. They can also be buried under loads of fill, say if someone tried to build on top of them. The compacted soils are rendered powerless to function normally. Without a water connection and functioning soils there will be no wetland plants- and the wetland is essential destroyed- or lost.
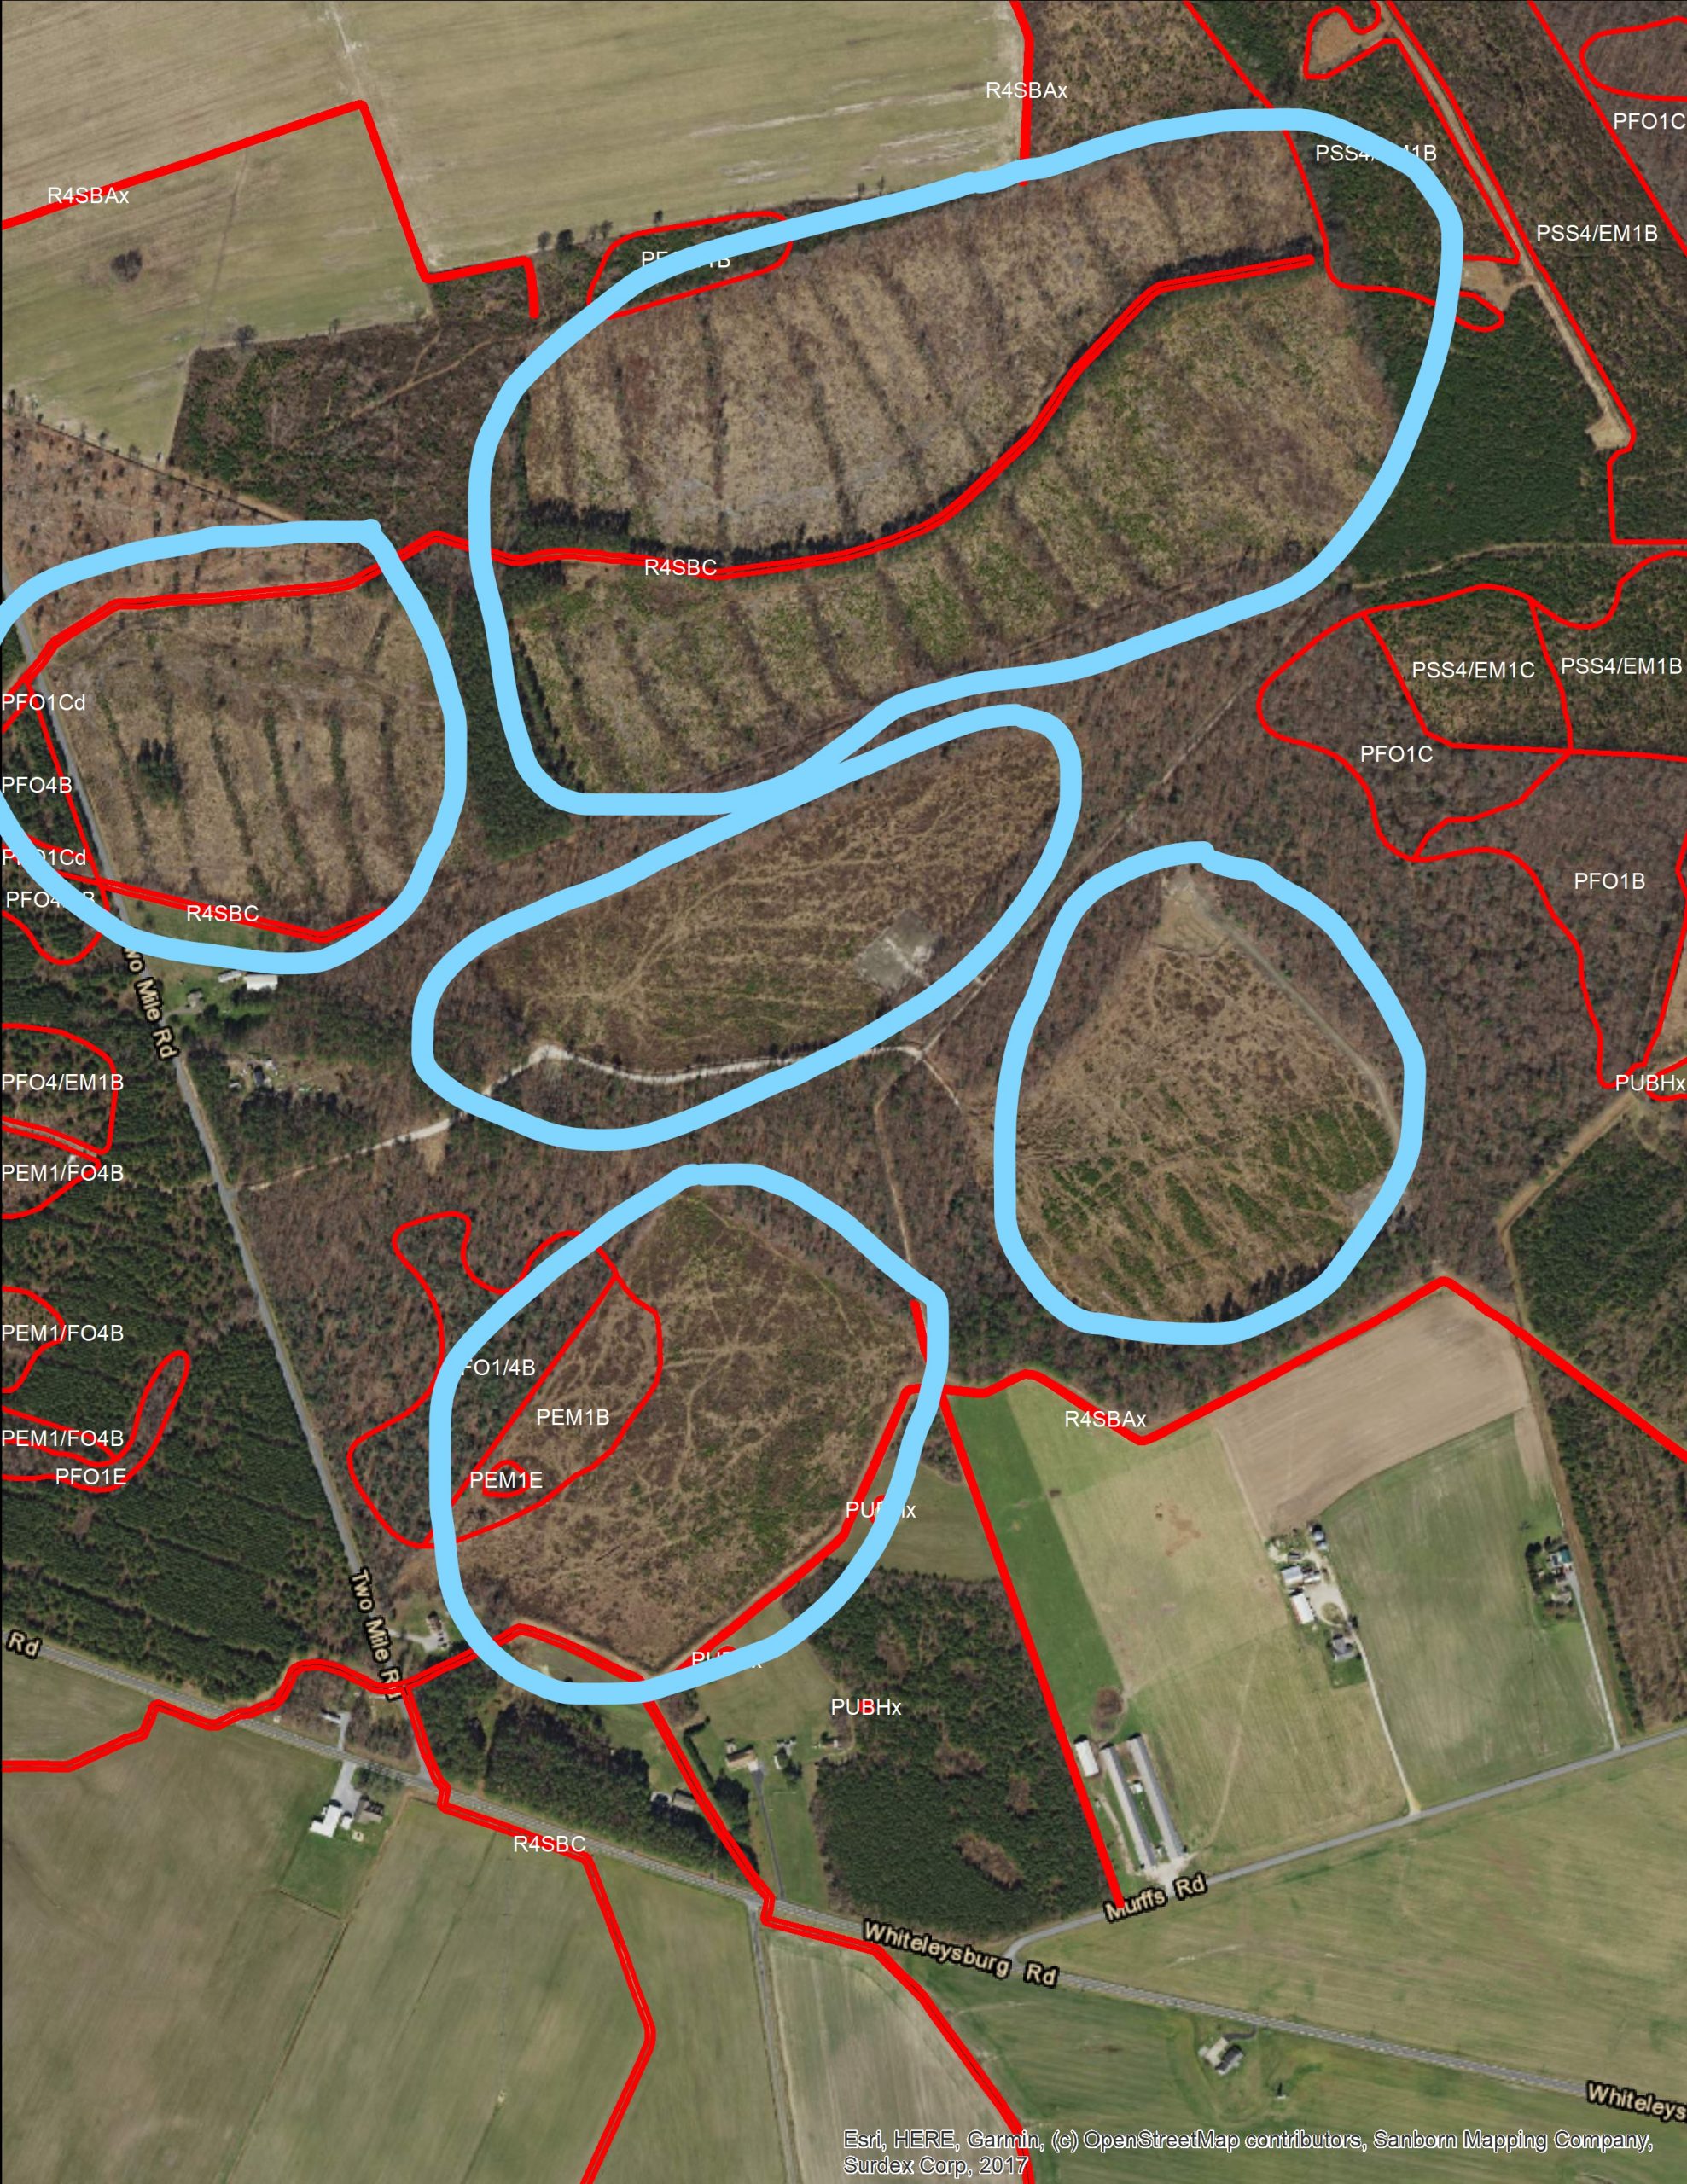
Who would want to live in or on a wetland, you ask? Not me! What right-minded homeowner would think that building a house or a business on a wetland is a good idea? Unfortunately, many missteps can lead to this situation. First, not all wetlands look like wetlands year round. Delaware’s most common wetland is forested but flat and holds water at or just below the surface even in the wet season, not flooded in pools and ponds. It’s not the obvious bog type wetland you may have envisioned. Because of this, they often go unmarked and, therefore, fall victim to conversion and loss. Also, by the time buyers see a house for sale, the ground has been so worked and pushed around that you would never suspect a wetland was underneath layers of fill dirt.
So did Delaware’s wetlands suffer a loss between 2007 and 2017 according to this statewide mapping project? Yes, and the figures indicated that the pace and source of losses have stayed consistent. Through an analysis of wetlands that were there in 2007 but were gone in 2017 to calculate the acreage, type (tidal or non-tidal) and sources of loss over the span of a decade. We classified sources into six categories: clearing, development, agriculture, transportation/utilities, environmental impacts and technique improvements. Technique improvements were a class of mapping changes related to the computer software and updates in technology, not changes on the landscape, and were therefore not included in loss calculations.
Our study showed that Delaware lost 3,011 acres of wetlands statewide between 2007 and 2017. Most of the wetlands destroyed or converted were non-tidal (92%), with losses to tidal wetlands making up the remaining portion (8%). Losses to non-tidal wetlands occurred mostly in forested, headwater wetlands
The sources of wetland losses over that decade vary greatly for non-tidal compared to tidal wetlands. Our coasts are being impacted by sea level rise and heavier, more frequent storms, so it’s no surprise that 66% of tidal wetland losses were due to environmental impacts such as erosion. Only 13% (31 acres) were deemed due to development and another 10% (23 acres) were lost to transportation and utility work. Land clearing, usually timber harvesting, may be a transition to development or may regrow, caused another 9% (22 acres) which leaves 2% (4 acres) lost due to conversion to agriculture (poultry, row crops, livestock).
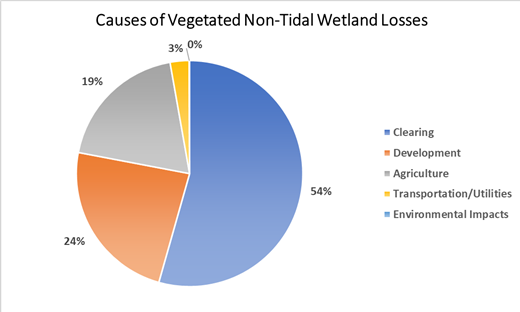
Compare that to non-tidal wetlands, where 54% (1,508) of losses were due to clearing, 24% (654 acres) to development, 19% (533 acres) to agriculture and only 3% (75 acres) to transportation and <1% (2 acres) to environmental impacts. A very different picture between wetland types which is important to recognize. It’s also important to point out that wetland loss rates and causes vary around the state. Sussex County is host to nearly half (48%) of Delaware’s wetlands but accounted for 66% of wetland losses between 2007 and 2017. Subsequently, 23% came from Kent County and 8% from New Castle County.
For those of you who think in terms of watersheds instead of counties, we can speak your language too. Statewide wetland losses from 2007-2017 occurred mostly in the Chesapeake Bay Basin (62.5%, 1,884 acres), followed much further back by the Delaware Bay Basin (18.7%, 565 acres) and Inland Bays (16.6%, 501.5 acres). The Piedmont Basin which does is not comprised of many wetlands, contributed 1.9% or 60 acres of wetland lost during this time.
Unfortunately, this study reported many continuing trends compared to a similar study for 1992-2007. The Chesapeake Bay Basin and Sussex County were the main sources of loss, with clearing (timber harvesting) again as the main source, followed by development and agriculture. Forested freshwater wetlands continue to suffer the most losses. It is not that surprising , though, given that wetland regulatory programs have not been strengthened in the last 10 years and the push for economic growth continues to take priority.
Based on these results we know we have our work cut out for us. We need to do more to raise awareness for wetland values and protection against destruction. Looking ahead to 2027, we would like to see a decline in wetland losses, an evening out of trends among counties and basins and a decrease in forested wetland habitat loss.
Delaware's Governor
State Agencies
Elected Officials
General Assembly
Delaware Courts
State Employees
Cities & Towns
Delaware State Code
State Regulations
Business First Steps
Phone Directory
Locations Directory
Public Meetings
Voting & Elections
Transparency
Delaware Marketplace
Tax Center
Personal Income Tax
Privacy Policy
Weather & Travel
Contact Us
Corporations
Franchise Tax
Gross Receipts Tax
Withholding Tax
Delaware Topics
Help Center
Mobile Apps
E-mail / Text Alerts
Social Media

Built by the Government Information Center
©MMXVIII Delaware.gov

