Facebook Twitter Instagram YouTube

Written on: March 16th, 2022 in Wetland Assessments
By Alison Rogerson, DNREC’s Wetland Monitoring and Assessment Program
By now, you may have read through our previous Status and Trends blog posts focused on current acreage, or status, of wetlands, as well as trends such as gains and losses. There is still one trends category to dive into: changes. This is probably the most difficult category for us to summarize and report on. It comes down to the details, looking back and forth from older maps and photos to more recent ones. It’s also the least intuitive category of wetland trends for readers to recognize. How do wetlands change? Why is it important to track if they are still wetlands? Let’s jump in.
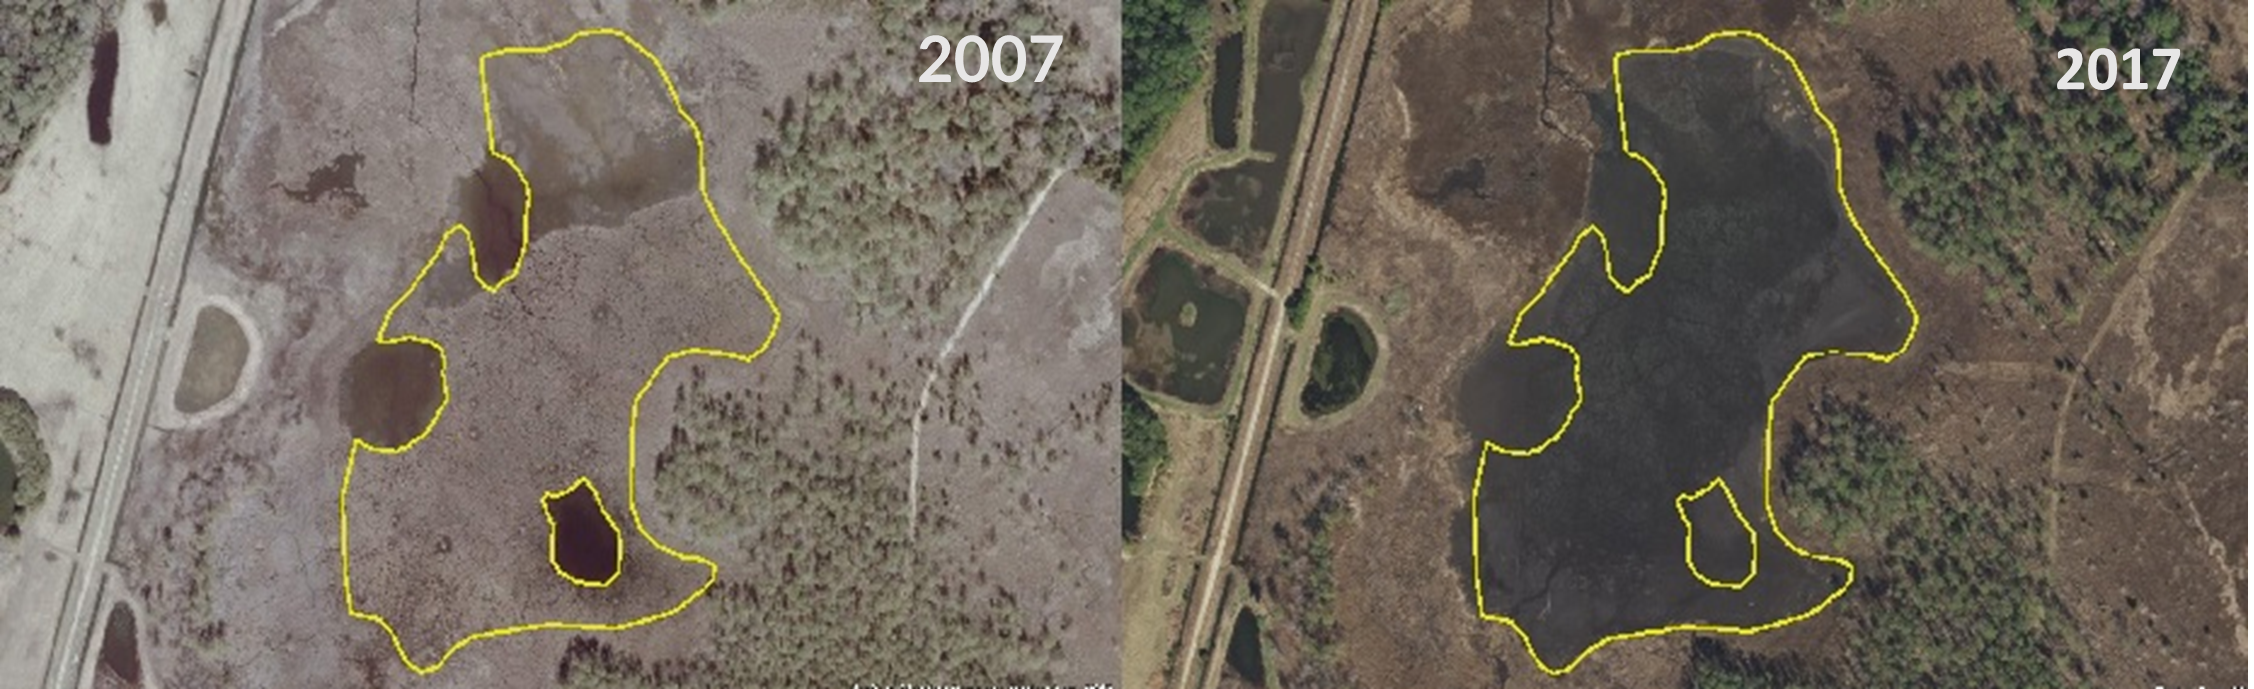
The changes category focuses on wetlands that have, no surprise here, changed over time, in this case between 2007 and 2017. Their boundaries haven’t moved, that would be a gain or a loss. This category takes a closer look at how existing wetlands are shifting and why. This may seem like splitting hairs, but a total of 13,822 acres of wetlands changed from one wetland type to another from 2007 to 2017 statewide. That’s about 4.6% of Delaware’s wetlands statewide. Definitely a topic worth keeping track of.
Of those 13,822 acres, 6,169 acres of changes occurred in tidal wetlands (44%) and 7,652 acres (55%) were in non-tidal wetlands. We divided them into four groups, mostly using changes in cover or vegetation as an indicator. It’s interesting to think about what factors could lead to a wetland change.

Shifts in Water Type
This group covers two areas: changes in water regime from Palustrine (or freshwater) to Estuarine (saltwater) and changes in tidal pattern from nontidal to tidal. Changes in hydrology accounted for 2,100 acres and confirm to us that water levels are rising and saltwater lines are moving further and further inland. Exposure to tides and salt water permanently alters the plants and animals that can live there. In this group, we can see how the relatively rare tidal freshwater wetlands and being pushed further inland until they will become pinched out at the base of created lakes and ponds.
Vegetation Growth
While most changes were because of a loss of vegetation, we also documented a small amount of growth. Accounting for only 10% of overall changes, plant growth from muddy or bare bottom into emergent vegetation, or growth in lakes and ponds occurred equally in tidal and nontidal wetlands.
Vegetation Loss
Loss of vegetation made up almost 1/3 of all wetland changes and was seen predominantly in tidal wetlands (94%). In these cases, tidal wetlands used to have grassy emergent plants but changed into muddy or bare bottom areas. This could also be related to sea level rise and erosion. Once coastal areas are bare and lack roots to hold soils together, they are vulnerable to further erosion and loss of shoreline habitat completely. This is a natural process being amplified by climate change that is being documented at an alarming rate along the east coast.
Vegetation Shifts
Shifts in the vegetation community can go both ways; plants growing in and up but also plants dying off or back. This was the biggest group for changes, accounting for 44% overall, and 90% of the time occurred in nontidal wetlands. Succession is a natural process and can happen when a grassy wetland grows into scrub shrub habitat over time. Alternatively, as we see water levels and flooding increase, we also see vegetation dying off, reverting from a forested wetland to an emergent wetland, sometimes becoming an expanded floodplain along a river. Lastly, deforestation was also a major source of vegetation shifts in nontidal wetlands, stemming mostly from timber harvesting. Sometimes those areas recover and revegetate over the years but often suffer from the physical impacts of harvesting.
Although these changes may seem really detailed, they can help us track the less obvious processes affecting wetlands in Delaware. Perhaps the acreage in an area didn’t change much but the make up of those wetlands tell us they are going through a downward process towards a loss. Keeping trends straight between tidal and nontidal systems is important too, as we decide how to protect and restore them.
Delaware's Governor
State Agencies
Elected Officials
General Assembly
Delaware Courts
State Employees
Cities & Towns
Delaware State Code
State Regulations
Business First Steps
Phone Directory
Locations Directory
Public Meetings
Voting & Elections
Transparency
Delaware Marketplace
Tax Center
Personal Income Tax
Privacy Policy
Weather & Travel
Contact Us
Corporations
Franchise Tax
Gross Receipts Tax
Withholding Tax
Delaware Topics
Help Center
Mobile Apps
E-mail / Text Alerts
Social Media

Built by the Government Information Center
©MMXVIII Delaware.gov

