Delaware Wetlands logo
WMAP Blog


Facebook  Twitter  Instagram  YouTube  RSS Feed

  Archived Posts From: 2018

wetland-animals

Marsh Crab Investigation

Written on: May 18th, 2018 in Wetland Animals

Guest Writer: Kari St.Laurent, DNREC-Delaware National Estuarine Research Reserve

Have you even been to a salt marsh and noticed that the river banks at low tide look like Swiss cheese? Marsh crabs create burrows in various shapes and sizes in the sediment to serve as refuges during high tide, at night, and sometimes even in the winter. These burrows can greatly vary in shape and size depending on the crab species and the conditions of the salt marsh. Nonetheless, these burrows can be deep (>1 ft1) and can be densely aggregated in the marsh sediment. One study has measured up to 300 crab burrows per a squared meter2 and another study found that the burrows took up 14% of the sediment volume in the study area3!

Marsh crab burrows have been shown to increase the marsh’s ability to drain water, increase the decomposition rates in the sediment, and are a way for oxygen to get mixed down into the anoxic marsh sediments4. In fact, the respiration from marsh crab burrows has been found to account for 20-90% of the sediment respiration in a tidal marsh5! These ‘Swiss cheese’ holes are an integral part of the marsh ecosystem.

However, shifts in this ecosystem balance, such as an over-abundance of marsh crab, can wreak havoc on the tidal marsh. A little over a decade ago, tidal marshes in New England were experiencing huge die-back events. The population of the native purple marsh crab skyrocketed due to a lack of predation6 and the massive numbers of purple marsh crabs ate the cordgrass faster than it could grow. A perfectly healthy or slowly decaying marsh can depend on the fine balance of burrow density and which marsh crab species are most abundant.

Figure 1. Fiddler crabs collected in a pitfall trap using old tennis ball cans. The crabs were then safely returned to their marsh home alive! Photo credit: DNERR

Last summer, 15 National Estuarine Research Reserves conducted a coordinated marsh crab study to investigate marsh crab burrows – reaching across 15 different tidal marshes from Delaware (that’s us!) to California to Mississippi to Maine. This included field surveys to count burrow densities and identify the most dominant species present, desktop surveys to measure the marsh elevation and distance from a waterway, and analyses such as the nearest tidal datum. To help with the crab identification, pitfall traps where made from recycled tennis ball cans and passed around the Reserves (Figure 1).

Last September (2017), it was the Delaware National Estuarine Research Reserve’s (DNERR) turn to collect data. DNERR researchers deployed 30 pitfall traps which captured some of marsh crabs as they scrambled along the marsh surface. This metric cannot tell you the crab abundance, but it can tell which crab species are present. Crabs were identified, measured for size, and determined to be male or female (Figure 2). Next, DNERR researchers counted the number of burrows within a 0.25 meter quadrat at 30 different locations throughout a marsh at the St. Jones Reserve. Massive amounts of data were collected – especially when you factor in the other 14 other NERRS! The data analysis is still on-going and the 15 NERRS hope to have a manuscript completed by the end of the year.

Figure 2. A Uca minax marsh crab getting measured with calipers. Photo credit: DNERR

In our pitfall traps here in Delaware, we captured 66 marsh crabs and identified 3 different species. The majority were Uca minax, or the red-jointed fiddler crab. We also caught 5 Uca pugilator, or the sand fiddler crab. Lastly, about 5% of the crabs caught were Sesarma reticulatum, also known as the purple marsh crab, the same crab responsible for the New England salt marsh loss. But not to worry – the purple marsh crab is native and can be found naturally in low numbers throughout salt marshes in the Mid-Atlantic.

DNERR researchers hope to periodically repeat this study to see if any changes occur at the St. Jones Reserve. So stay tuned as we continue to analyze our data and compare it with salt marshes across the country!


Citations (Additional fun reads!)

1Christy, John H. “Burrow structure and use in the sand fiddler crab, Uca pugilator (Bosc).” Animal Behaviour 30, no. 3 (1982): 687-694.

2McCraith, Barbara J., Leonard R. Gardner, David S. Wethey, and Willard S. Moore. “The effect of fiddler crab burrowing on sediment mixing and radionuclide profiles along a topographic gradient in a southeastern salt marsh.” Journal of Marine Research 61, no. 3 (2003): 359-390.

3Morrisey, D. J., T. H. DeWitt, D. S. Roper, and R. B. Williamson. “Variation in the depth and morphology of burrows of the mud crab Helice crassa among different types of intertidal sediment in New Zealand.” Marine Ecology Progress Series (1999): 231-242.

4Bertness, Mark D. “Fiddler crab regulation of Spartina alterniflora production on a New England salt marsh.” Ecology66, no. 3 (1985): 1042-1055.

5Montague, Clay L. “The influence of fiddler crab burrows and burrowing on metabolic processes in salt marsh sediments.” In Estuarine comparisons, pp. 283-301. 1982.

6Holdredge, Christine, Mark D. Bertness, and Andrew H. Altieri. “Role of crab herbivory in die-off of New England salt marshes.” Conservation Biology 23, no. 3 (2009): 672-679.


Tags: , , ,

wetland-assessments

Watching the Tide Come In: Environmental Thermography Meets Tidal Wetland Hydrology

Written on: May 18th, 2018 in Wetland Assessments

by Tom McKenna, Delaware Geological Survey, University of Delaware

Working in tidal wetlands, we all know to watch the tide both for safety, sampling, and science reasons. But what do we really know about how tidal wetlands are inundated? The dynamics of the ebbing and flooding tide in deep (> 1 meter) tidal channels is a relatively well-known hydrologic process. However, our knowledge is limited for flow in shallower channels and on the marsh platform, partly due to limitations of our instrumentation. For example, does water flow over the banks of the larger channels before spilling over from smaller ones? Or, does water flow out of the landward end of channels before spilling over the sides?

Most models in the literature describe water spilling over the banks of larger channels. Collecting in situ data to quantify hydrologic processes, including inundation of marsh platforms, is difficult due to soft sediment, shallow water, tides, and the spatially dynamic nature of shallow water flow. Environmental thermography is a technique that can overcome these obstacles by imaging inundation of tidal flats and the marsh platform from a ground-based remote sensing platform. A thermal imager records a time series of images by sensing temperature with time in every image pixel over a broad area. Imaging is best from a high platform like a ground-based tower or helikite (balloon with wings and string) that can stay close to one position. Drones can supplement the work but are limited by short flight times (half-hour). What makes this technique so amenable to tidal wetlands is the ability to collect imagery at time-scales (minutes/hours) below those of the dominant stresses on the system (semi-diurnal tides, day/night), unlike thermal sensors on aerial or satellite platforms.

Figure 1. A comparison of thermal and visual images during a flood tide in a marsh along Brockonbridge Gut in Kent County, DE.

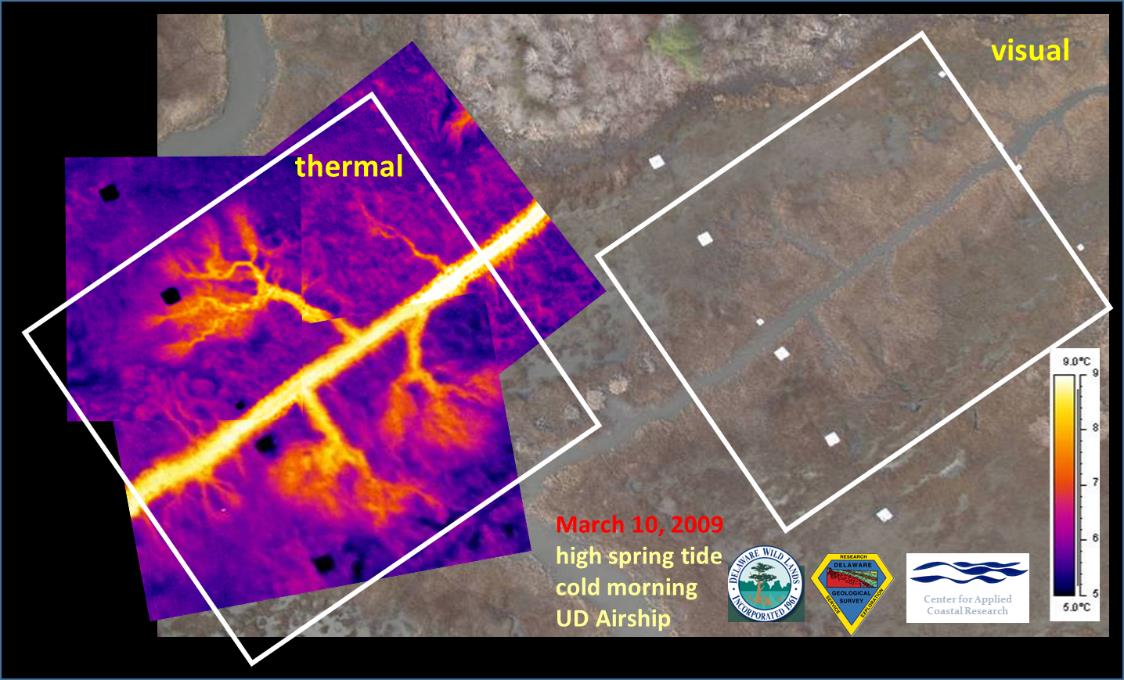
Two examples are shown in the figures: one from a decommissioned airship (Figure 1), and one from a bucket truck (Figure 2). The images from March 2009 are a snapshot taken during flood tide in the marsh along Brockonbridge Gut in Kent County. Warmer temperatures (water) are orange and cooler temperature (marsh and mudflat) are purple. The inundation pattern is not visible in the visual image, but it is clear in the thermal image that tidal water flows into distinct channels then “feathers” out near the headwaters of these channels.

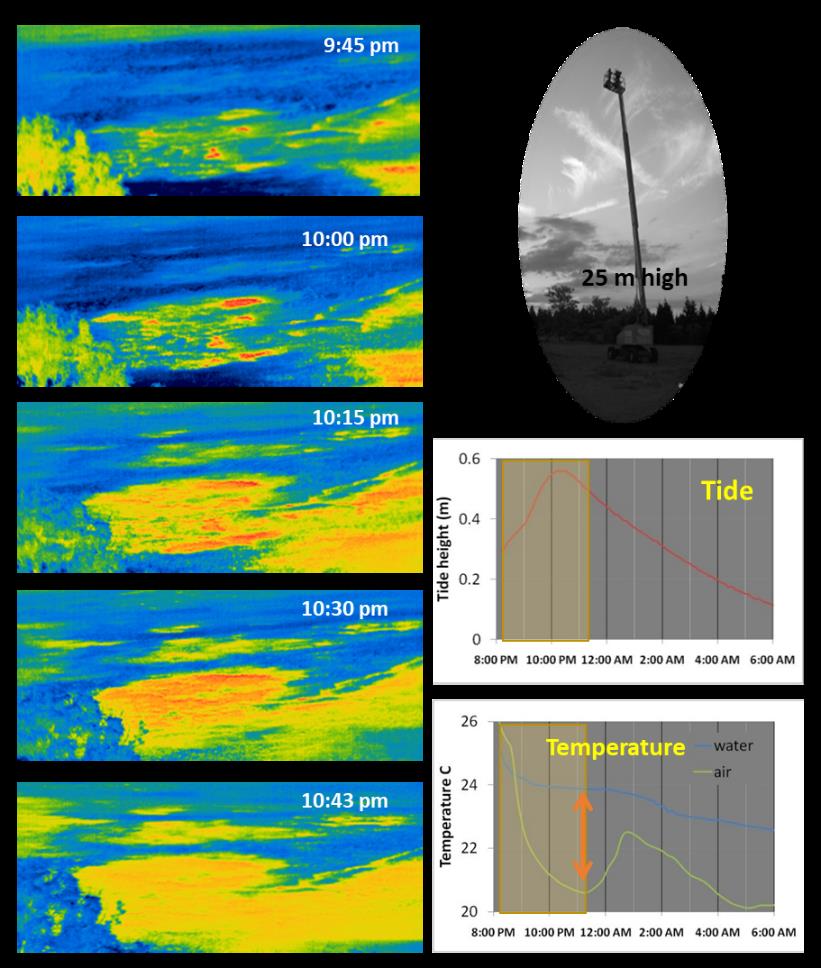
Figure 2 shows a sequence of images collected over one hour in June 2009 in a marsh along the Murderkill River in Kent County. Warmer water is yellow, orange, and red, and cooler marsh is blue and black. The flooding tide first enters the area from a ditch, seen as the yellow linear feature on the right side of the image at 9:45 pm. But the bulk of flow, seen as warmer water entering from the lower right corner at 10:15 pm, is from another ditch that is out of the image to the right.

Figure 2. A thermal image sequence at a marsh along the Murderkill River in Kent County, DE.

Currently, the nature of shallow water flow on the marsh platform remains largely uncharacterized. The capabilities of both models of hydrodynamic flow on the platform and models of salt marsh evolution (e.g. accretion/deposition, formation of channels) are outpacing the data collection required to validate those models. One of our goals over the next few years is to use environmental thermography to help constrain some numerical models that explicitly model flow on the marsh platform. This will provide resource managers with better information on the dynamic hydrologic processes in tidal wetlands and relationships to sediment accretion/erosion, biogeochemistry and water quality, ecological function, and impacts from anthropogenic activity, climate change, and rising sea level.


Tags: , , , ,

wetland-restorations

The Delaware Watershed Resources Registry: An Online Geospatial Planning Tool

Written on: May 18th, 2018 in Wetland Restorations

by Mark Biddle, DNREC Wetland Monitoring and Assessment Program

The Delaware Watershed Resources Registry (WRR) is an online GIS mapping tool that is useful for prioritizing preservation and restoration of several important land types, including wetlands.

In our everyday lives, we are always looking to find efficiency with our time and make tasks easier. If you were planning a project, how would you feel if 30-40 percent of pre-project planning was already done for you? You would likely say, “Yes, please!” Well that’s exactly what the Delaware Watershed Resources Registry (WRR) provides for projects in the open environment. The WRR is an online GIS mapping tool that prioritizes areas for preservation and restoration of wetlands, riparian zones, terrestrial areas, and stormwater management control. The 8 models within the WRR help you find opportunities for restoration and preservation when needed to either improve or preserve the condition of areas on the landscape, or can be used to locate replacement resources for unavoidable environmental impacts. This online tool provides assistance to developers, natural resource planners, consultants, transportation planners, conservation organizations, and local land use planners.

To offer an example of the utility of the WRR, let’s first look to a typical DelDOT project involving a new road. The process involves consideration of a handful of different alignments – basically, different pathways the new road could take. Each one of these pathways has to be evaluated for its potential costs and for its impact to natural or built resources. The WRR is the tool planners would use as a filter or first-cut at determining which new road pathways are the best or the worst as far as costs and impacts. The information within the WRR allows DelDOT planners to see all the geospatial data together at one time. Prior to having the WRR, planners would have to assemble all of this data separately for each and every project. Previewing the data all together leads to avoiding potential ‘roadblocks,’ such as contaminated sites, wellhead protection areas, underground storage tanks, high quality ecological habitat, etc. – the characteristics that can be difficult to deal with during permitting and construction, and typically increase the overall cost of the project. Once DelDOT settles on the best new road alignment, planners can then use the restoration and preservation opportunities provided by the 8 models in the WRR to find sites to offset unavoidable impacts and produce required mitigation.

Figure 1. WRR output showing opportunities from the wetland restoration model near the Blackbird Creek Reserve in Delaware.

The WRR provides the same utility to consultants and developers planning a new residential development. The online mapping tool shows where many resources exist on the landscape and is able to incorporate these considerations into the development layout from very early in the process, which saves time and money further into the process if changes are made or required by permitting agencies. The preservation and restoration opportunities within the WRR are also useful to conservation organizations conducting preservation and restoration on their lands. Each of the 8 models scores preservation and restoration opportunities using a 1-5 scale, with 5 being the best (Figure 1).

For those of you who may use the WRR online tool, it is no different than any other landscape-level mapping resource; it’s very informative, should be used strictly as guidance, and any opportunities identified in the WRR should be verified on the ground. The WRR concept was designed by Maryland Environmental Services in partnership with the Environmental Protection Agency initially as a tool for the Maryland DOT to assist with their permitting and regulatory needs. Because of the flexibility of the WRR, it evolved into an online resource tool for more than just DOT projects. With funding assistance from Federal Highways, the Delaware WRR used the same structure and models, and formed a technical advisory committee to determine the best geospatial data to inform each of the 8 models. The geospatial data is all publically available and is either pulled from the Delaware FirstMap site, or from other nationally available datasets. The WRR provides a single tool for many users and provides project efficiency, consistency, ease of use, and cost effectiveness.


Tags: , , ,

wetland-assessments

The Dynamic Nature of Delaware’s Seasonal Freshwater Wetlands

Written on: May 18th, 2018 in Wetland Assessments

by Erin Dorset, DNREC Wetland Monitoring and Assessment Program

Figure 1. From top to bottom: spring, summer, and fall at a long-term monitoring site in Ted Harvey State Wildlife Area.

Are wetlands always wet?

In some ways, wetlands are self-explanatory: lands that are wet. But oftentimes, it’s not so simple. Some wetlands are wet for the entire year and always have water on the surface or are very damp. Those wetlands are pretty easy to identify. However, some wetlands are actually dry on the surface for a lot of the year, and only have water on the surface during wet seasons, like spring. Such seasonal freshwater wetlands are common in Delaware, and include wetland types such as forested flats, wet meadows, and Coastal Plain Ponds.

These types of wetlands are extremely important for wildlife. Yet, they are the most vulnerable to loss and degradation from human impacts. Part of this vulnerability stems from general misunderstanding; if these wetlands are seen during a dry season, people may not know that they are actually wetlands and should be protected and preserved because of the important services that they provide. Even though they are dry on the surface for part of the year, they are still wetlands!

What do seasonal freshwater wetlands look like?

The forested flat pictured here (Figure 1) is one example of a seasonal freshwater wetland. It is located within Ted Harvey State Wildlife Area, and is at one of WMAP’s long-term monitoring sites. The 3 photos shown here (Figure 1) are all taken from the exact same spot in the wetland.

However, they all look drastically different. This shows you just how dynamic a single wetland can be, changing so much throughout the course of a year! The wetland usually has water on the surface several inches deep in the spring time because of snow melt and rain. In the summer, the wetland may or may not have water on the surface, depending on how much precipitation has fallen. It is very common in the fall for the flat to completely lack surface water and appear dry.

Figure 2. This Coastal Plain Seasonal Pond was dry on the surface when the photo was taken, but the water marks on the trees show that it has water on the surface for part of the year. Photo credit: Bill McAvoy.

You might now be wondering: how can you tell if an area is a wetland when there is no water on the surface? Luckily, nature leaves behind many clues. If you know what to look for, you can be a wetland detective! Here are just some of the common signs that an area that may appear dry when you first see it is actually a wetland:

• Water marks (Figure 2) and moss on the bases of tree trunks
• Blackened leaves on the forest floor
• Wetland plants growing in the area
• Water near the surface in the soil

As illustrated in Figure 1, it is always a good idea to see an area during different seasons to understand the complete picture. To learn more about different kinds of seasonal freshwater wetlands and what they look like, click here!


Tags: , , ,
+