Facebook Twitter Instagram YouTube

Written on: May 25th, 2022 in Wetland Assessments
By Alison Rogerson, DNREC’s Wetland Monitoring and Assessment Program
The summer of 2019 was like most for the Wetland Monitoring and Assessment Program field crew. Similar to summers before it since 2000, we had a selected watershed to focus on and call ‘office’ for the growing season. Field crews spend the summer visiting randomly selected wetland sites, ranging all types, located on public as well as private property. Our job includes trekking to each selected site and conducting a wetland health assessment; a checklist of wetland stressors that allows biologists to rate how well a wetland is functioning. Each site gets rolled together to produce an overall watershed grade which allows DNREC to rate and track how healthy and functioning Delaware’s wetlands are.
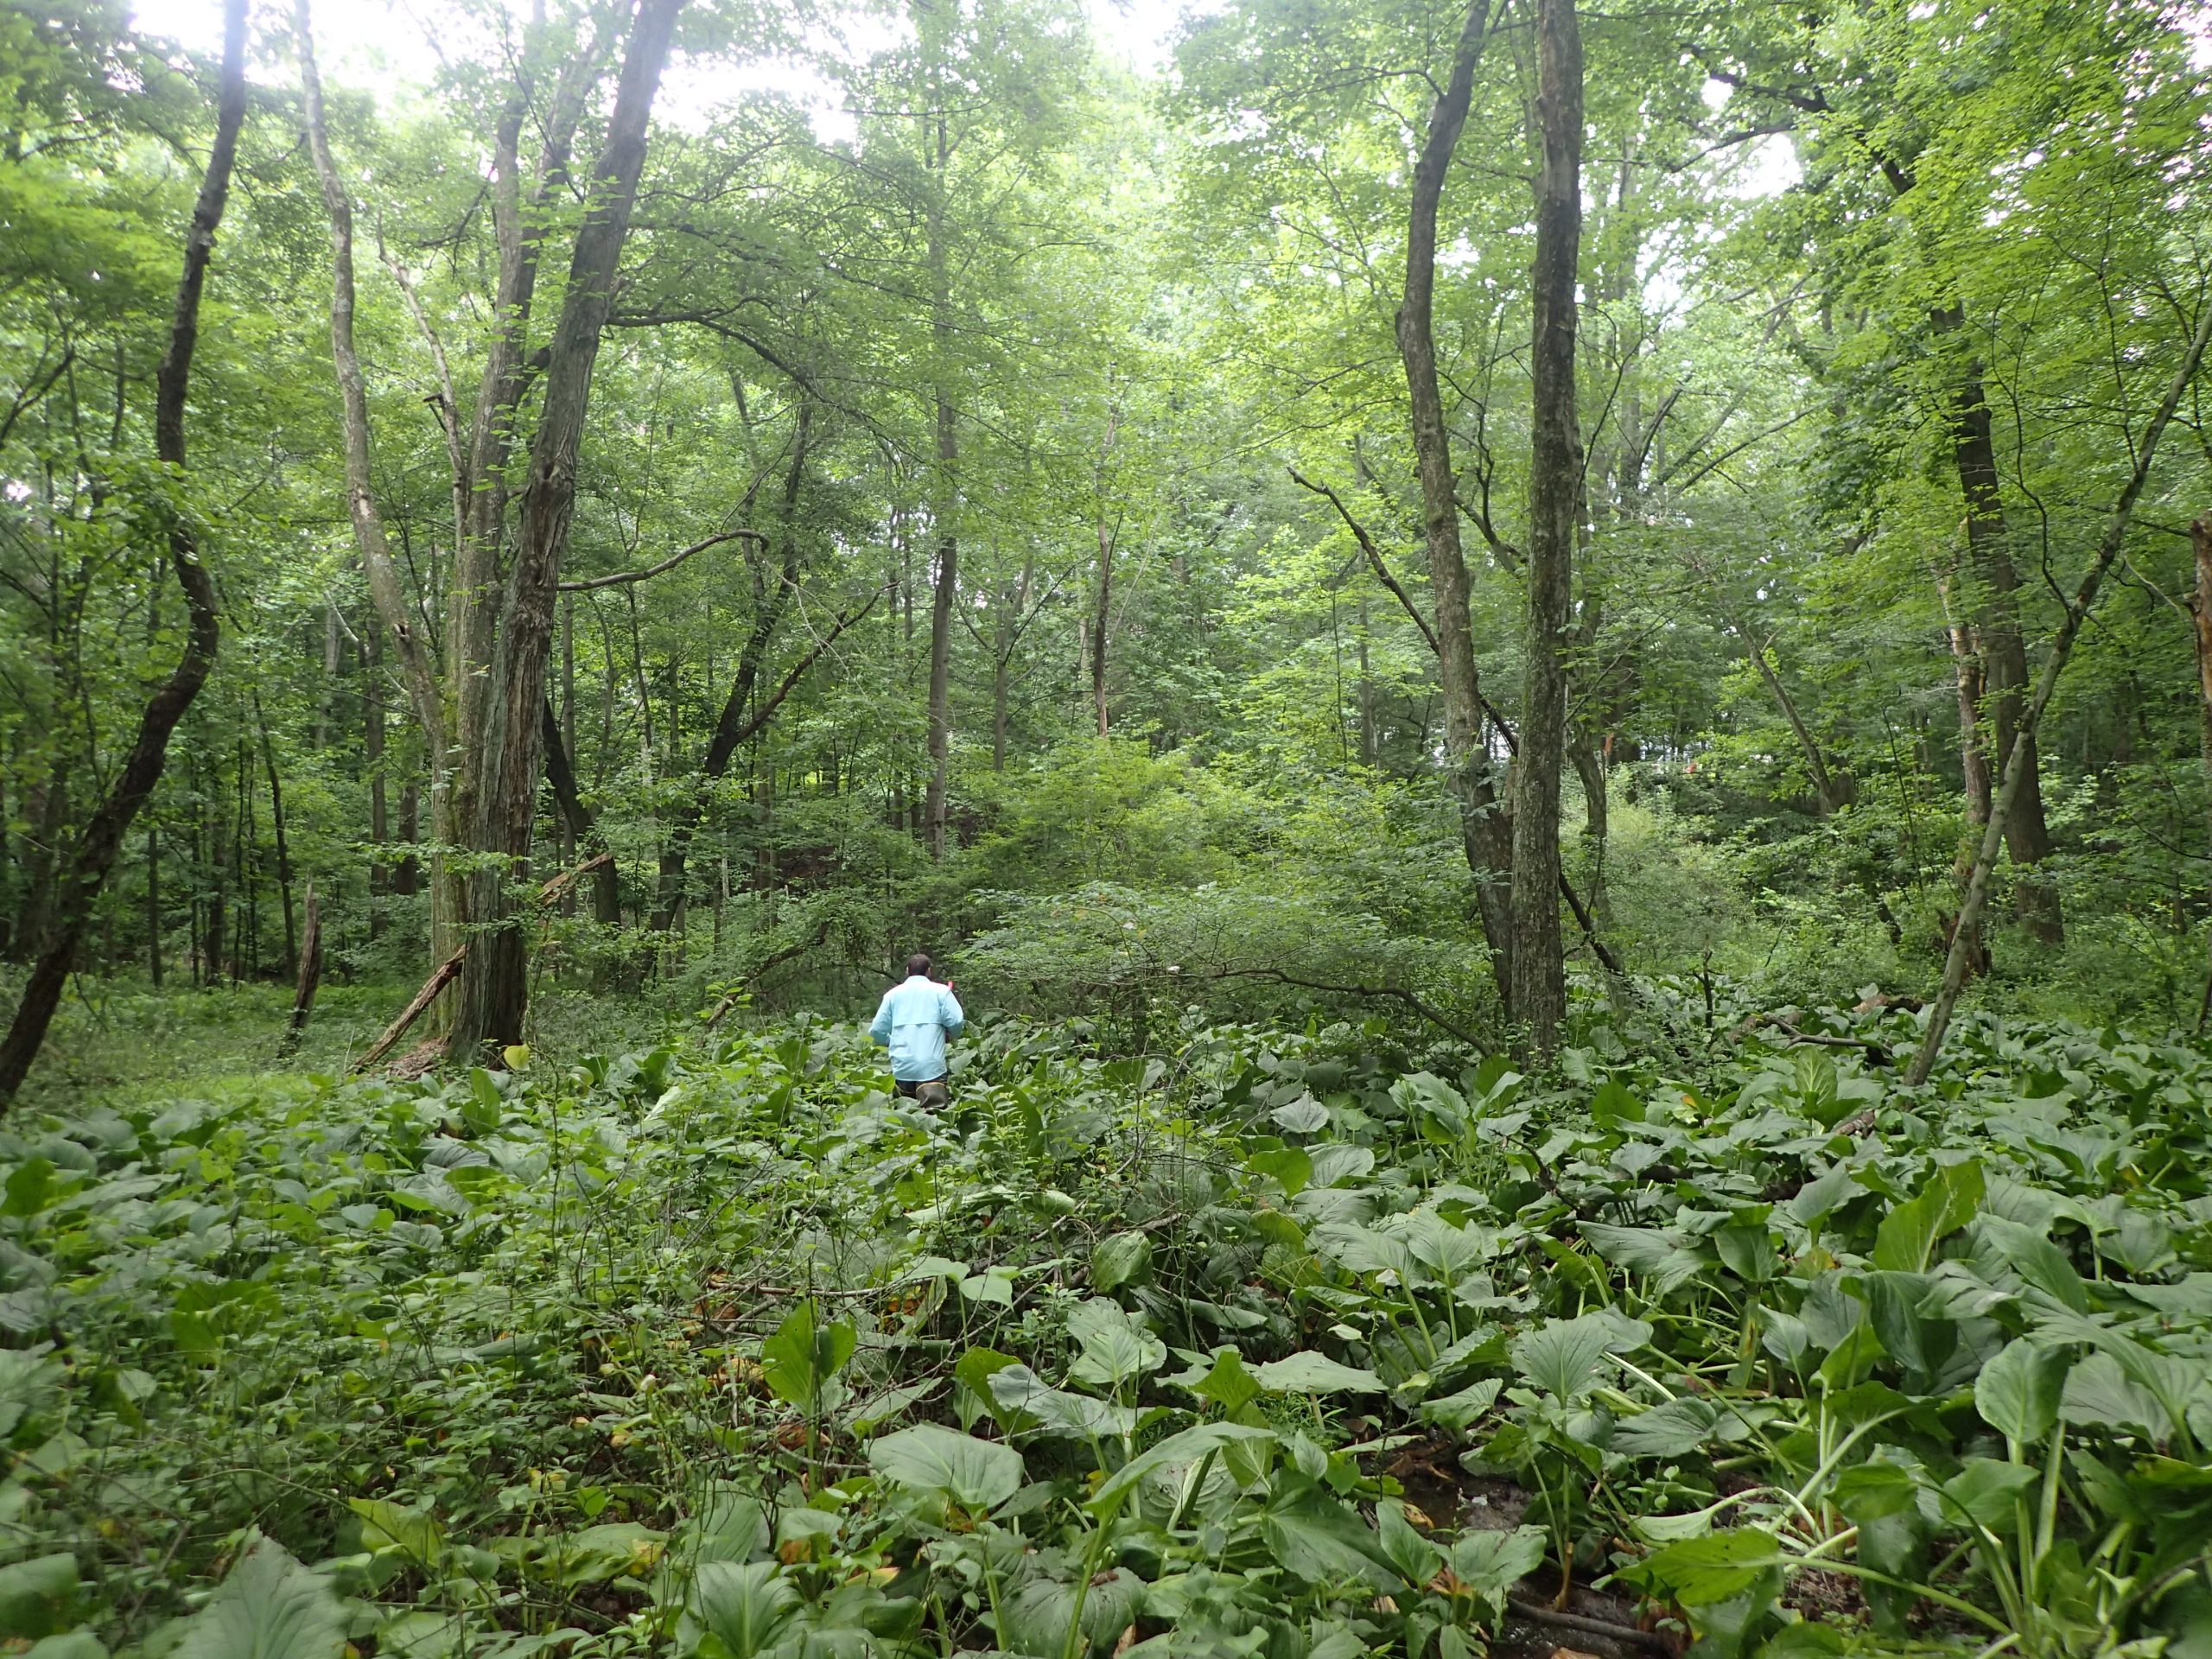
The Brandywine River watershed’s Delaware portion stretches from the Christina River to the Pennsylvania state line all the way across the arc- from the Delaware River to the notch. It includes some beautiful landscape but also a lot of highly developed land. Plus signs of topography! Coming from Dover, it was a change of scenery to have boulders and hills. We replaced the tidal wetlands of the coastal plain with groundwater seeps of the piedmont, and it made for an interesting summer- if you are a wetland geek, I guess, which I am.
We spent three hot months exploring the Brandywine watershed, navigating narrow windy roads with absolutely no shoulder, and scrambling up and down steep banks to finally assess 68 wetlands in total. The data we collected was used to rate the health of all wetlands watershed wide – which includes about 2,800 acres. All in all, wetlands in the Brandywine watershed earned a C+ grade. Not the worst but not the best. Here’s more on why they didn’t make the honor roll and how we can make improvements.
The healthiest wetland types were headwater forest flats and groundwater seeps, both earning a B-. Floodplain riverine and isolated depressions both earned C’s. Each wetland type was different in why they received their grade. Flats had excellent habitat quality but poor buffer quality due to development. Groundwater seeps had excellent hydrology but very poor buffer quality due to development. Riverine wetlands had good habitat and hydrology but poor buffer quality. Lastly, depressions had excellent hydrology but very poor buffer quality. All of this is captured colorfully on the Brandywine watershed report card.
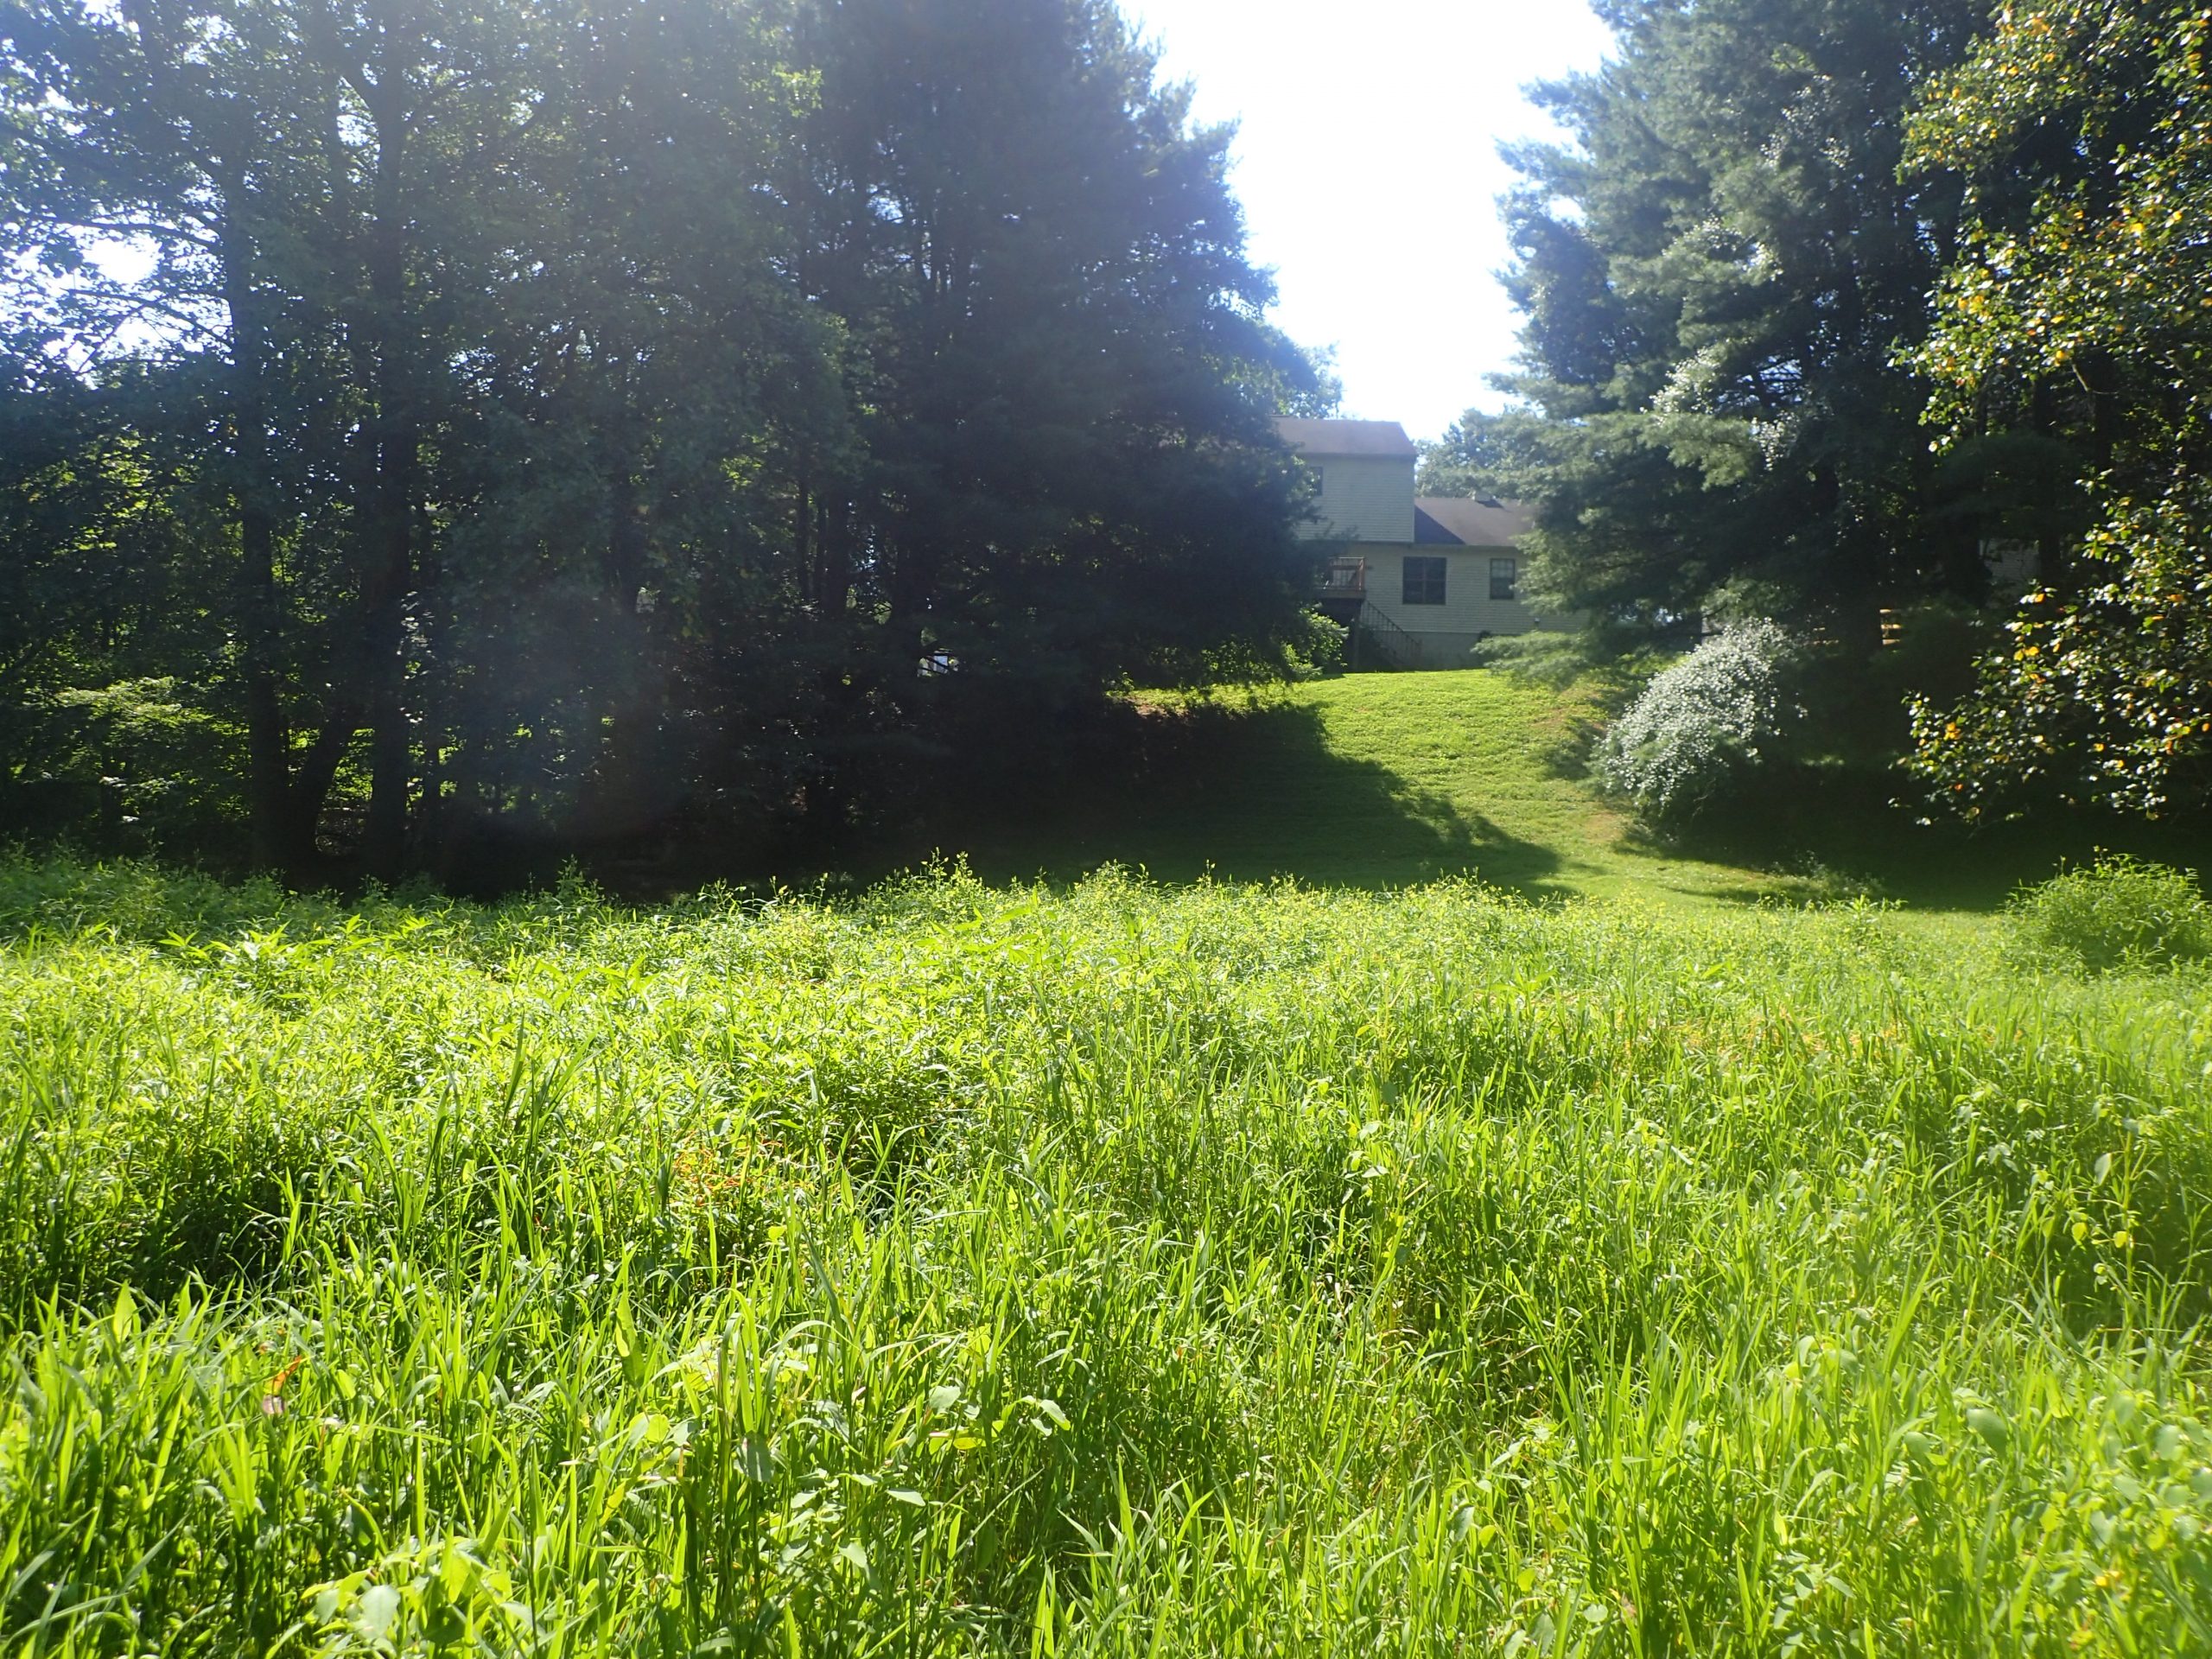
Any good student would want to bring their grades up after mid-terms, so what can we do to improve wetland health? For all four wetland types, the category with the poorest condition rating was the wetland buffer, or area immediately surrounding. We can’t take away development that is already there but we can do things to protect wetlands and waterways from as many present and future impacts. Presently, landowners can maximize the protection buffers offer by planting more and mowing less- create a wide (50ft), thick vegetated area between yards or roads and wet areas. In the future, we need development to plan for a wide riparian buffer around wetlands and streams. This allows harmful chemicals and nutrients to be filtered out before reaching our waterways. It also provides rich and important plant and wildlife habitat.
For the full watershed health report visit: https://documents.dnrec.delaware.gov/Watershed/Wetlands/Assessments/Brandywine-Watershed-Condition-Report.pdf
Delaware's Governor
State Agencies
Elected Officials
General Assembly
Delaware Courts
State Employees
Cities & Towns
Delaware State Code
State Regulations
Business First Steps
Phone Directory
Locations Directory
Public Meetings
Voting & Elections
Transparency
Delaware Marketplace
Tax Center
Personal Income Tax
Privacy Policy
Weather & Travel
Contact Us
Corporations
Franchise Tax
Gross Receipts Tax
Withholding Tax
Delaware Topics
Help Center
Mobile Apps
E-mail / Text Alerts
Social Media

Built by the Government Information Center
©MMXVIII Delaware.gov

