Facebook Twitter Instagram YouTube

Written on: September 7th, 2016 in Wetland Assessments
By Brittany Haywood, DNREC’s Wetland Monitoring and Assessment Program
Did you know that 50% of wetlands in our coastal plains ecoregion are in good condition? The U.S. Environmental Protection Agency (EPA) organized the National Wetland Condition Assessment (NWCA) in 2011 to get these data, and now our Program (Wetland Monitoring and Assessment Program) is again helping to assess more of Delaware’s wetlands to contribute to the 2016 NWCA.
2011 National Wetland Condition Assessment In Brief:
Five years ago, the EPA conducted a wetland assessment to look at the changing conditions and health of the nation’s wetlands. This study broke the continent into four separate ecoregions, with Delaware falling into the coastal plains ecoregion. The ecoregion includes the Mississippi Delta and extends up to Cape Cod, Massachusetts.
For all wetland types in the coastal plains region, 50% of the estimated wetland area is in good condition; 21% is in fair condition and 29% is in poor condition based on the vegetation index used.
During the 2011 NWCA field season a total of 513 randomly selected sites were sampled from across the U.S., 17 from Delaware, representing 30,893,305 acres nationally. Wetlands were surveyed by using an army of field crews stationed across the nation. We were lucky enough to be one of them.
All in all, 48% of U.S. wetlands were found to be in good condition; 32% is in poor condition and the remaining 20% is in fair condition.
2016 Field Work
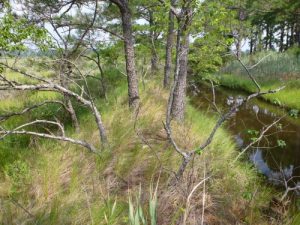
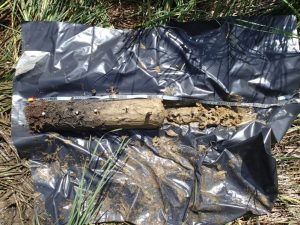
This summer we are at it again, collecting wetland data for the EPA about wetland health from 12 sites across Delaware. Some of the sites were repeats from 2011, and some of them were new. Each site visit involved 4 people from our program, and a soil scientist from National Resource Conservation Service (NRCS) geared up to go out and look at soil composition, plant communities, water quality, and buffer stressors. For a more detailed description of each parameter we looked at, please visit the 2011 Technical Report. Look for a report on the 2016 data from the EPA in the future!

Written on: September 7th, 2016 in Wetland Restoration
By Brittany Haywood, DNREC’s Wetland Monitoring and Assessment Program
A hot topic for scientists and residents of Milton as of late, has been the Prime Hook National Wildlife Refuge Marsh Restoration project. This Refuge had multiple breaches in its freshwater impoundments where saltwater from the Delaware Bay cut its way through the dunes. The breaches caused significant flooding; massive vegetation die offs, and returned the habitat from its man-made freshwater system to its historic slightly salty brackish system.
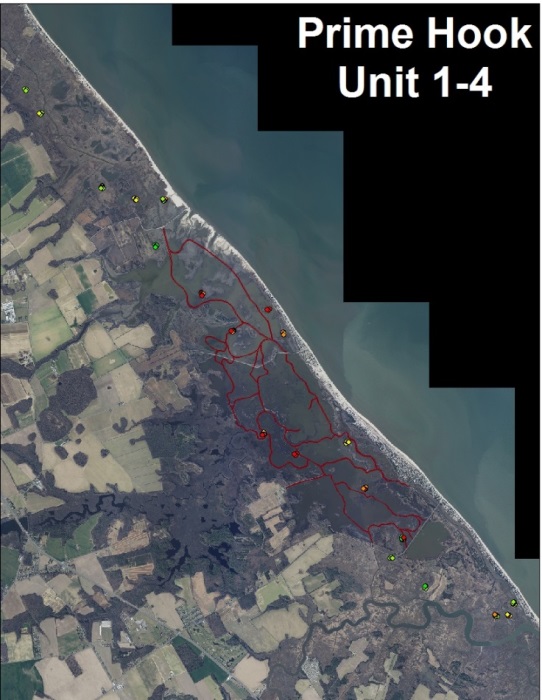
To solve these problems, the Prime Hook National Wildlife Refuge took on one of the largest restoration projects in the U.S. in the fall of 2015. The end goal, to create a self-sustaining system and return all the impoundments to a brackish tidally influenced ecosystem. The Refuge closed breaches, created over 20 miles of channels, planted thousands of plants, scattered thousands of seeds by airplane throughout the landscape, and provided design input for DelDOT’s new bridge.
So how will they know if it worked?
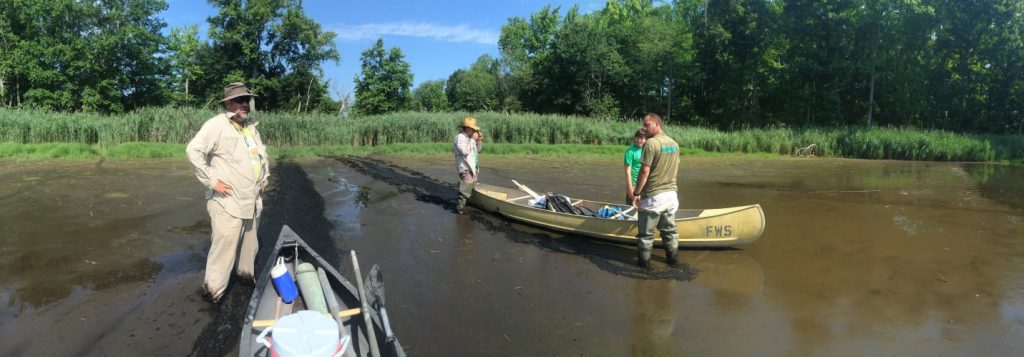
That’s where we (the Wetland Monitoring and Assessment Program) come in and help. In the summer of 2015, we provided baseline wetland monitoring before any restoration work had begun. Then, after the Refuge finished this summer we came back to do the first post restoration sampling.
Preliminarily, we have seen some remarkable changes in the landscape.
Two of our assessment points now have a channel flowing through them. This makes it harder to walk around our sites, but should provide some interesting data in the future on channel impacts to a developing wetland. One of the most visually noticeable changes is the lack of water in some of the assessment sites. Sites that were once completely covered with water pre-restoration now appear high and dry post-restoration even though they do not have any significant elevation change.

But, the most promising response to the restoration is the colonization in these open areas with various plant species; Bulrush, Common Rush, Sweetscent, and Marsh Hemp to name a few. Leptochloa fascicularis, Bearded Sprangletop, is a salt tolerant annual that has become more prevent and responded to the new and changing conditions. As expected, the plant communities are changing, and will continue to change and adjust over the next few years.
We are just starting to dig into our data, and will continue to monitor the Prime Hook National Wildlife Refuge Marsh restoration for the next three years in the hopes to better understand how wetland restorations change the landscape and return the vital wetland functions that we count on everyday.

What We Looked At, Quick and Dirty:
Delaware's Governor
State Agencies
Elected Officials
General Assembly
Delaware Courts
State Employees
Cities & Towns
Delaware State Code
State Regulations
Business First Steps
Phone Directory
Locations Directory
Public Meetings
Voting & Elections
Transparency
Delaware Marketplace
Tax Center
Personal Income Tax
Privacy Policy
Weather & Travel
Contact Us
Corporations
Franchise Tax
Gross Receipts Tax
Withholding Tax
Delaware Topics
Help Center
Mobile Apps
E-mail / Text Alerts
Social Media

Built by the Government Information Center
©MMXVIII Delaware.gov

