Facebook Twitter Instagram YouTube RSS Feed

Written on: March 14th, 2016 in Wetland Animals
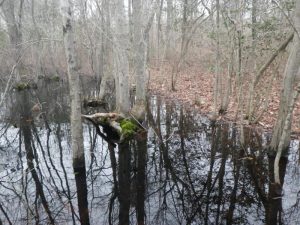 Thanks to all that extra water lying around, all sorts of amphibians start to come alive this time of year in Delaware. Frogs and salamanders use these seasonal pools of water, or wetlands, to breed and can only do so because predatory fish cannot survive the lack of permanent water. They then use the surrounding drier wetlands and uplands as summer habitat.
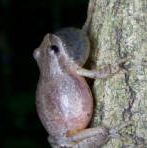
Northern Spring Peeper (USFWS)
In your travels you may have started to hear the sounds of the Spring Peeper. Their sound is a high pitched “peep peep peep” and when singing together it has been said, they sound like a chorus of bells. The Spring Peeper males use these sounds to attract a mate, and are one of the earliest breeding frogs you will find in the State. They are brown to grey in color and can be identified by an X-marking on the back.
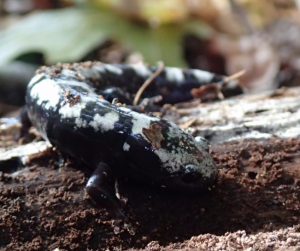
Marbled Salamander (WMAP)
Spotted, Marbled and Eastern Tiger Salamanders are just a few of the salamanders that roam the state. These salamanders are in the mole salamander family because they spend most of their adult life under leaves, logs or in holes or burrows in the ground. They only return to the water, such as that in vernal pools, to breed during the winter/spring months.

Written on: March 14th, 2016 in Wetland Assessments
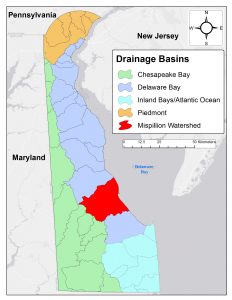
Mispillion Watershed is highlighted in red.
Updated: 10/28/2016, Grading scale was revised.
In the summer of 2012, DNREC’s Wetland Monitoring & Assessment Program rated the health of wetlands in the Mispillion and Cedar Creek River Watershed’s tidal and non-tidal flat and riverine wetlands. The goal of this project was to summarize recent gains and losses in wetland acreage, assess the condition, and identify impacts on the wetland. The watershed received an overall grade of C; broken down into tidal wetlands receiving a B-, non-tidal flat wetlands receiving a C+, and non-tidal riverine wetlands receiving a C-. This was the sixth watershed in Delaware to be assessed.
The Mispillion Watershed lost 20% of wetlands since the early 1700s, with the majority due to conversion of land to agricultural fields or developments and erosion from rising sea levels.
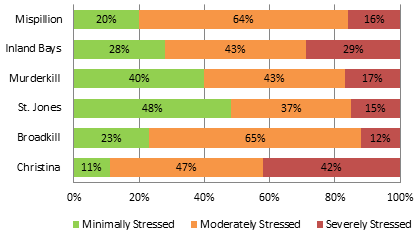
Comparison of wetlands across six of Delaware’s watersheds.
The three most common impacts to wetlands were the:
The full report, data and report card are now available online.

Written on: March 14th, 2016 in Outreach
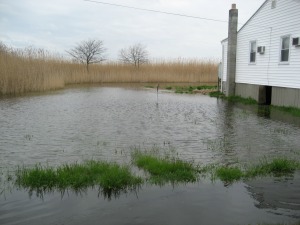 Winter storms and nor-easters brought excess rainfall, rough seas, and unseasonably high tides to Delaware this winter, highlighting the value of nature’s first line of defense against coastal storms; wetlands. Up and down Delaware’s coast, roadways were made impassable due to rising seas, buildings were battered by winds and water, and dunes and boardwalks were washed away by angry waves.
Written on: March 8th, 2016 in Wetland Assessments
Every summer since 1999 our Program has gone out into the wilderness to assess non-tidal wetland health in Delaware’s different watersheds. Why you ask? Well, we want to see how healthy Delaware’s wetlands are and if they are able to perform the natural tasks that make them so valuable. We identify which wetlands are in good shape, areas where wetlands are not doing so well and why, and highlight ones that could use a little tender love and care (AKA, they are good candidates for restoration and protection).
 In 2015, we focused on the Appoquinimink Watershed located in the northern third of Delaware. A watershed is an area of land in which all water drains and runs off towards a specific body of water, in this case the Appoquinimink River, and has a natural boundary defined by the tops of hills or ridges.
To begin our expedition, we divided the wetlands up by type depending on how they receive their water (groundwater, surface water flow, and precipitation) and where they exist (along a stream, in a shallow depression, and on forested terrace). Then we randomly selected wetland points on a map to be evaluated. We ended up visiting 31 headwater flats, 35 riverine and 29 depression wetlands throughout the summer in the Appoquinimink Watershed. As we hiked through each of the 95 sites, our team looked for a variety of features that could cause a wetland to be stressed or impacted. These features, or stressors, are broken up into three categories: habitat, hydrology and buffer.
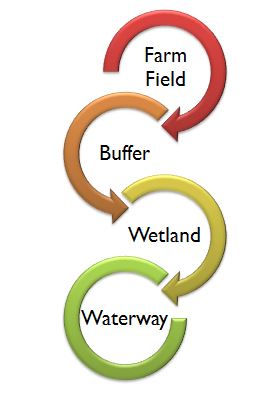
Figure 1. Nutrients and pesticides (shown as red) in runoff are reduced as water moves from farm field or yard to buffer to wetland to waterway.
Habitat stressors involve the physical and biological characteristics of the wetland and can include presence of invasive plants, excess nutrients, forest harvesting, farming or roadways.
Next up are the hydrologic stressors. Hydrology deals with water; what it is doing and where it is located (or not located) in the wetland. Some of the questions we ask ourselves are: Have ditches been added to the wetland? Has the stream channel been straightened or deepened? Does it have a stormwater pipes or point source pollution entering? Has it been filled or dug out?
Last on the list to take a look at are the buffer stressors. A buffer is a zone of land just outside of the wetland that has the ability to protect a wetland from disturbances occurring in the surrounding upland landscape. If severe impacts are too close to a wetland, it may overwhelm it causing it to not function properly. If a wetland has a good buffer, then it has a first line of defense against excess nutrients, pesticides or soil runoff, and that wetland can further protect pollution from entering waterways (Figure 1.). Some of the buffer stressors that we look for include farming practices, developments, roads, landfills, golf courses and ditches.
Why don’t you give identifying wetland stressors a try. Can you identify the major stressor that was put in the below wetland?

Aerial view before Route 1 was put in (1992) and after (2012). Wetland is in yellow circle.
If you guessed roadway, then you were right! As we go through each of these stressor categories at a site, we mark down what we see (like the roadway in the above picture), and tally everything up to give that wetland a score. The more stressors at a site, the lower the score, the poorer the health of that wetland. We are currently in the process of compiling all 95 scores for the a Wetland Health Report on the Appoquinimink Watershed.
The information gathered in this report will be used to compare wetland health across Delaware’s watersheds and make recommendations to landowners and policy makers to improve the health of Delaware’s wetlands. Be on the lookout for the Appoquinimink report in 2018.
Want more information on this process? Check these resources out:
Delaware Rapid Assessment Procedure
Watershed Wetland Health Reports
Delaware's Governor
State Agencies
Elected Officials
General Assembly
Delaware Courts
State Employees
Cities & Towns
Delaware State Code
State Regulations
Business First Steps
Phone Directory
Locations Directory
Public Meetings
Voting & Elections
Transparency
Delaware Marketplace
Tax Center
Personal Income Tax
Privacy Policy
Weather & Travel
Contact Us
Corporations
Franchise Tax
Gross Receipts Tax
Withholding Tax
Delaware Topics
Help Center
Mobile Apps
E-mail / Text Alerts
Social Media

Built by the Government Information Center
©MMXVIII Delaware.gov

